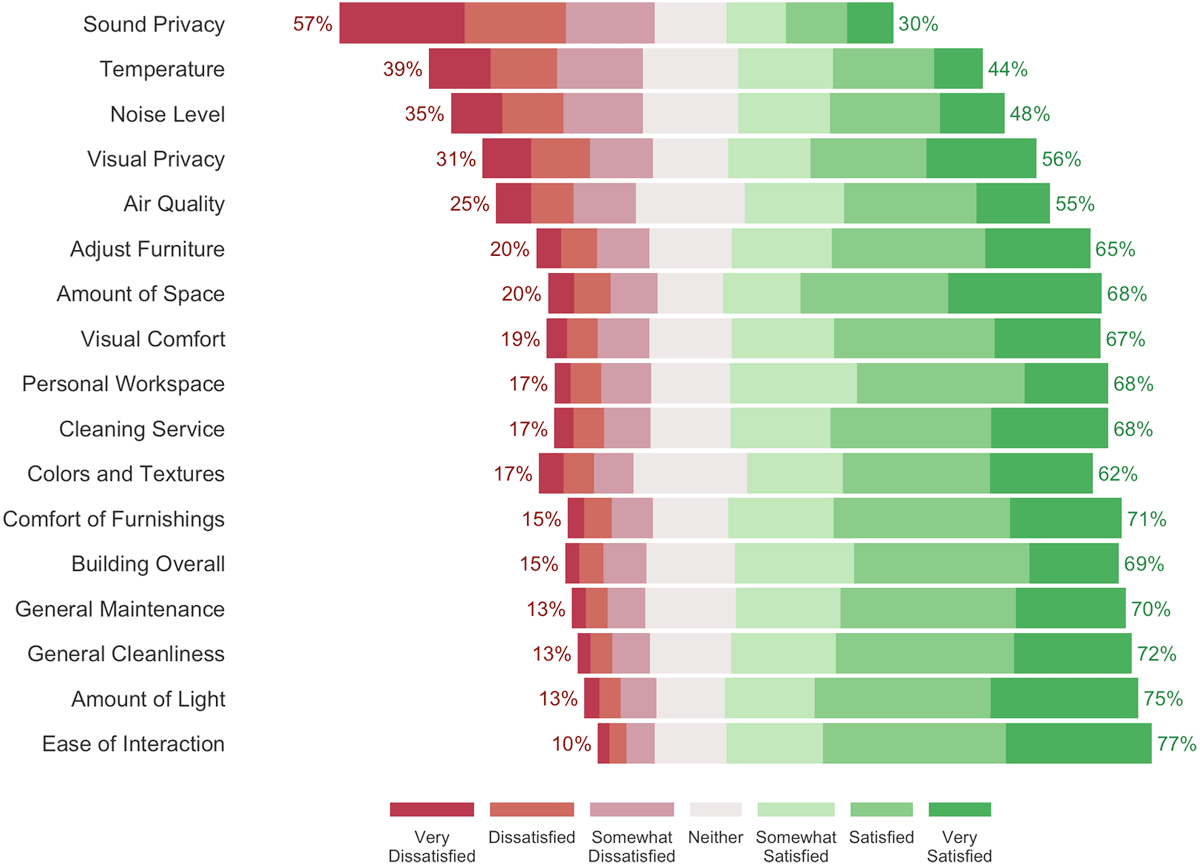
Occupant satisfaction with IEQ parameters
Survey data
R
Standard CBE plot to visualize satisfaction with IEQ parameters.
(Here you later put the full explanation, R/Python code chunks, etc.)
Note
Source: Parkinson et al. (2023)
DOI: https://doi.org/10.5334/bc.274
Code: View R code of similar plot on GitHub · Added by T. Kramer