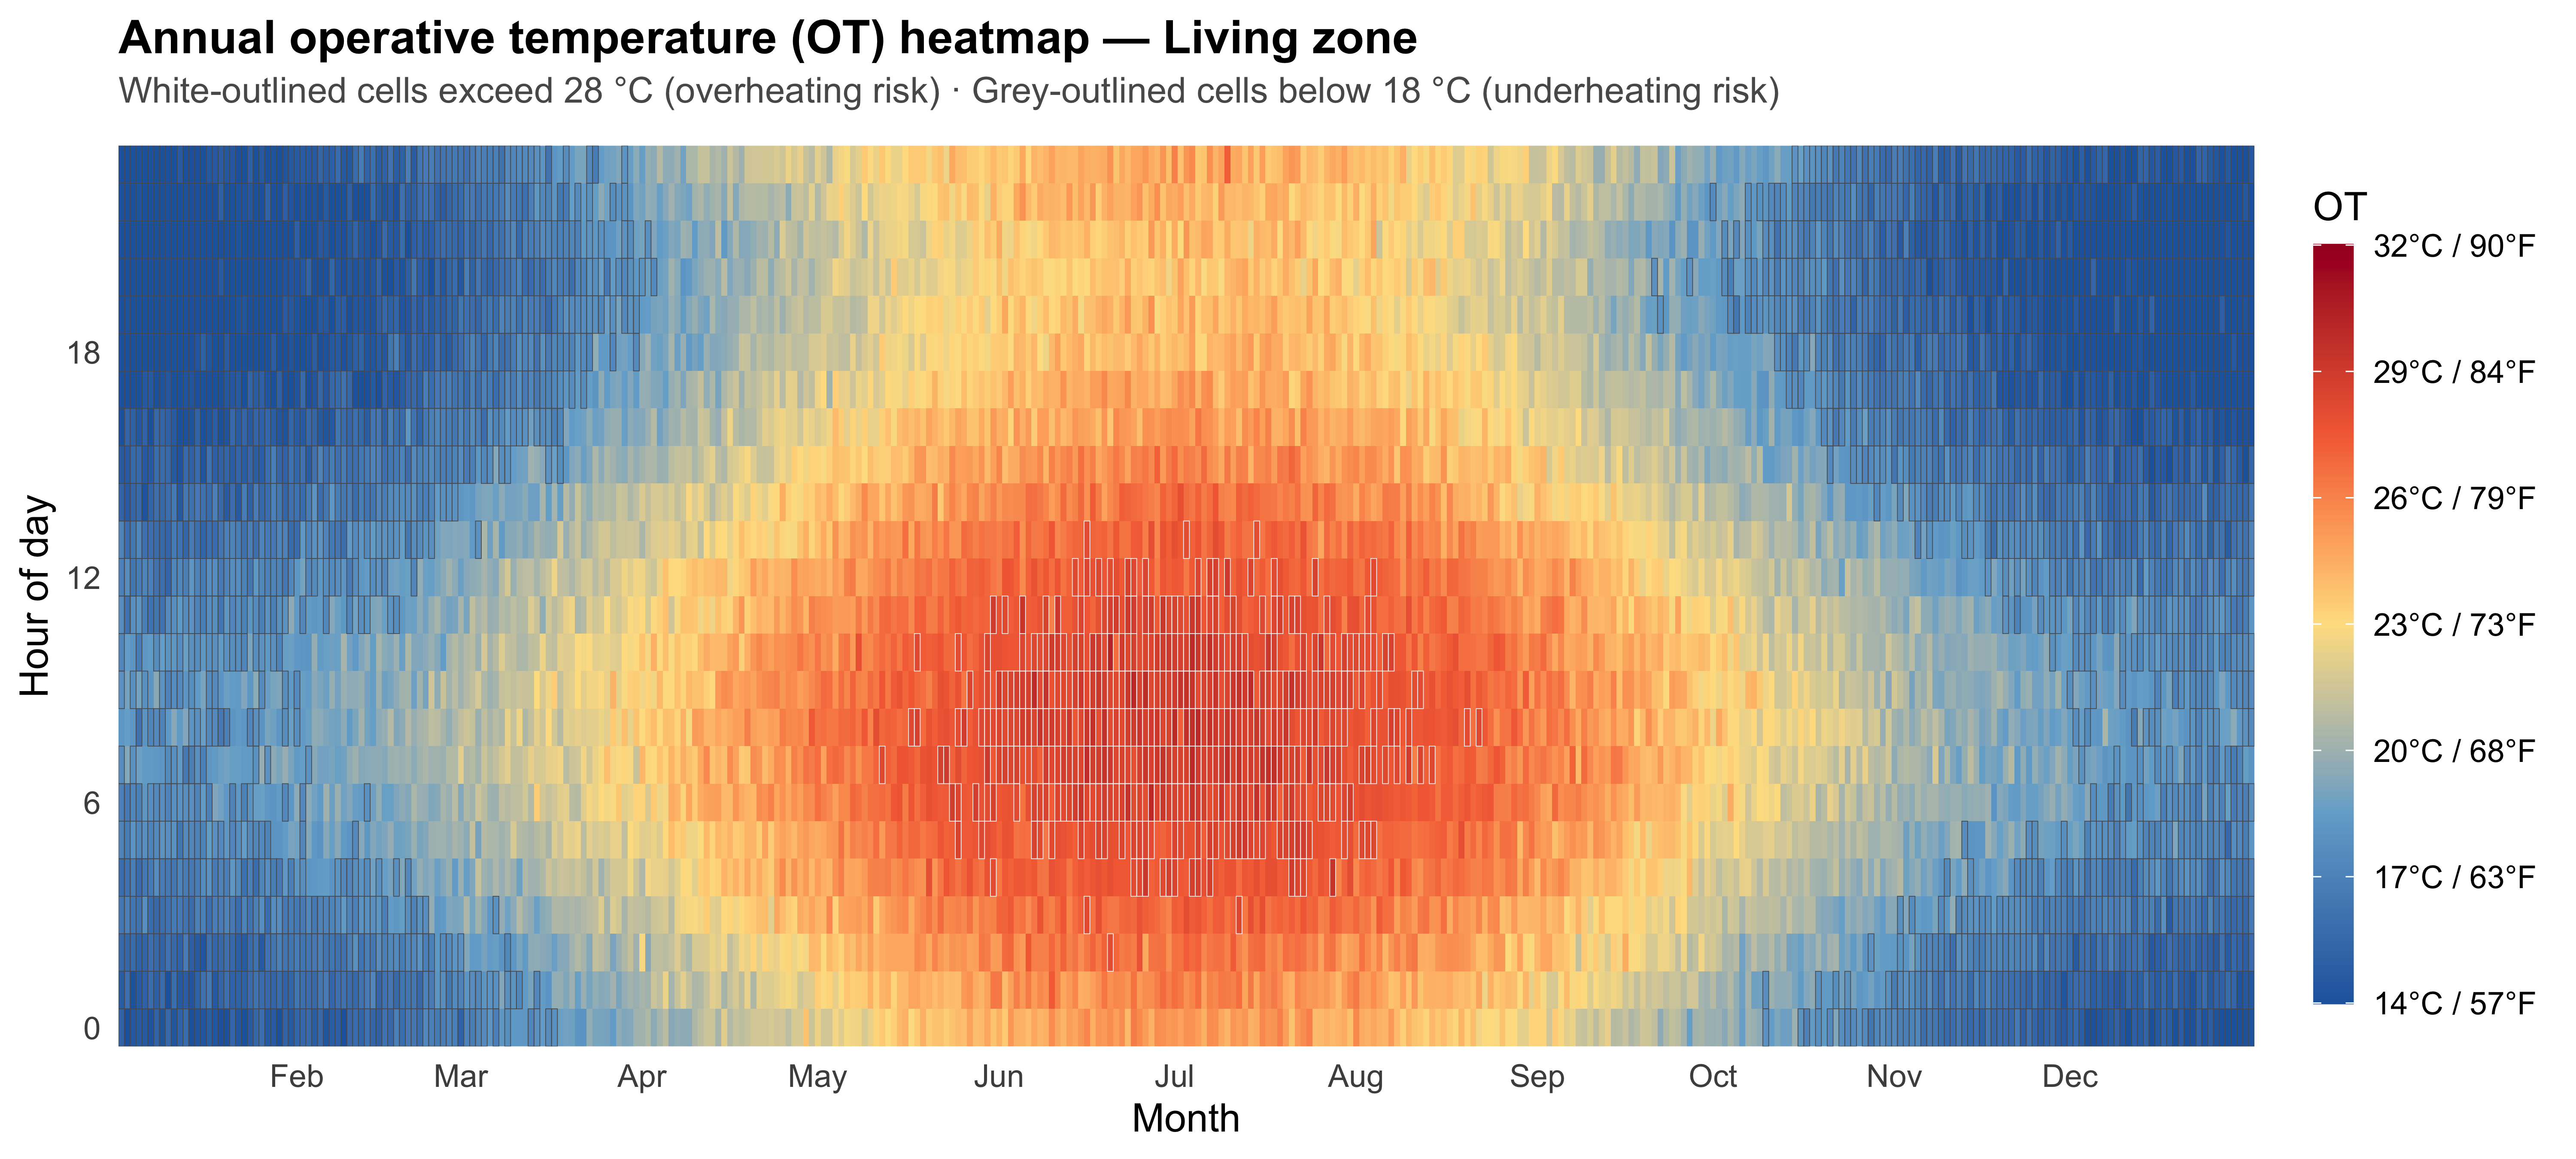
Full-year hourly heatmap of operative temperature with overheating and underheating risk thresholds, from hourly timeseries data.
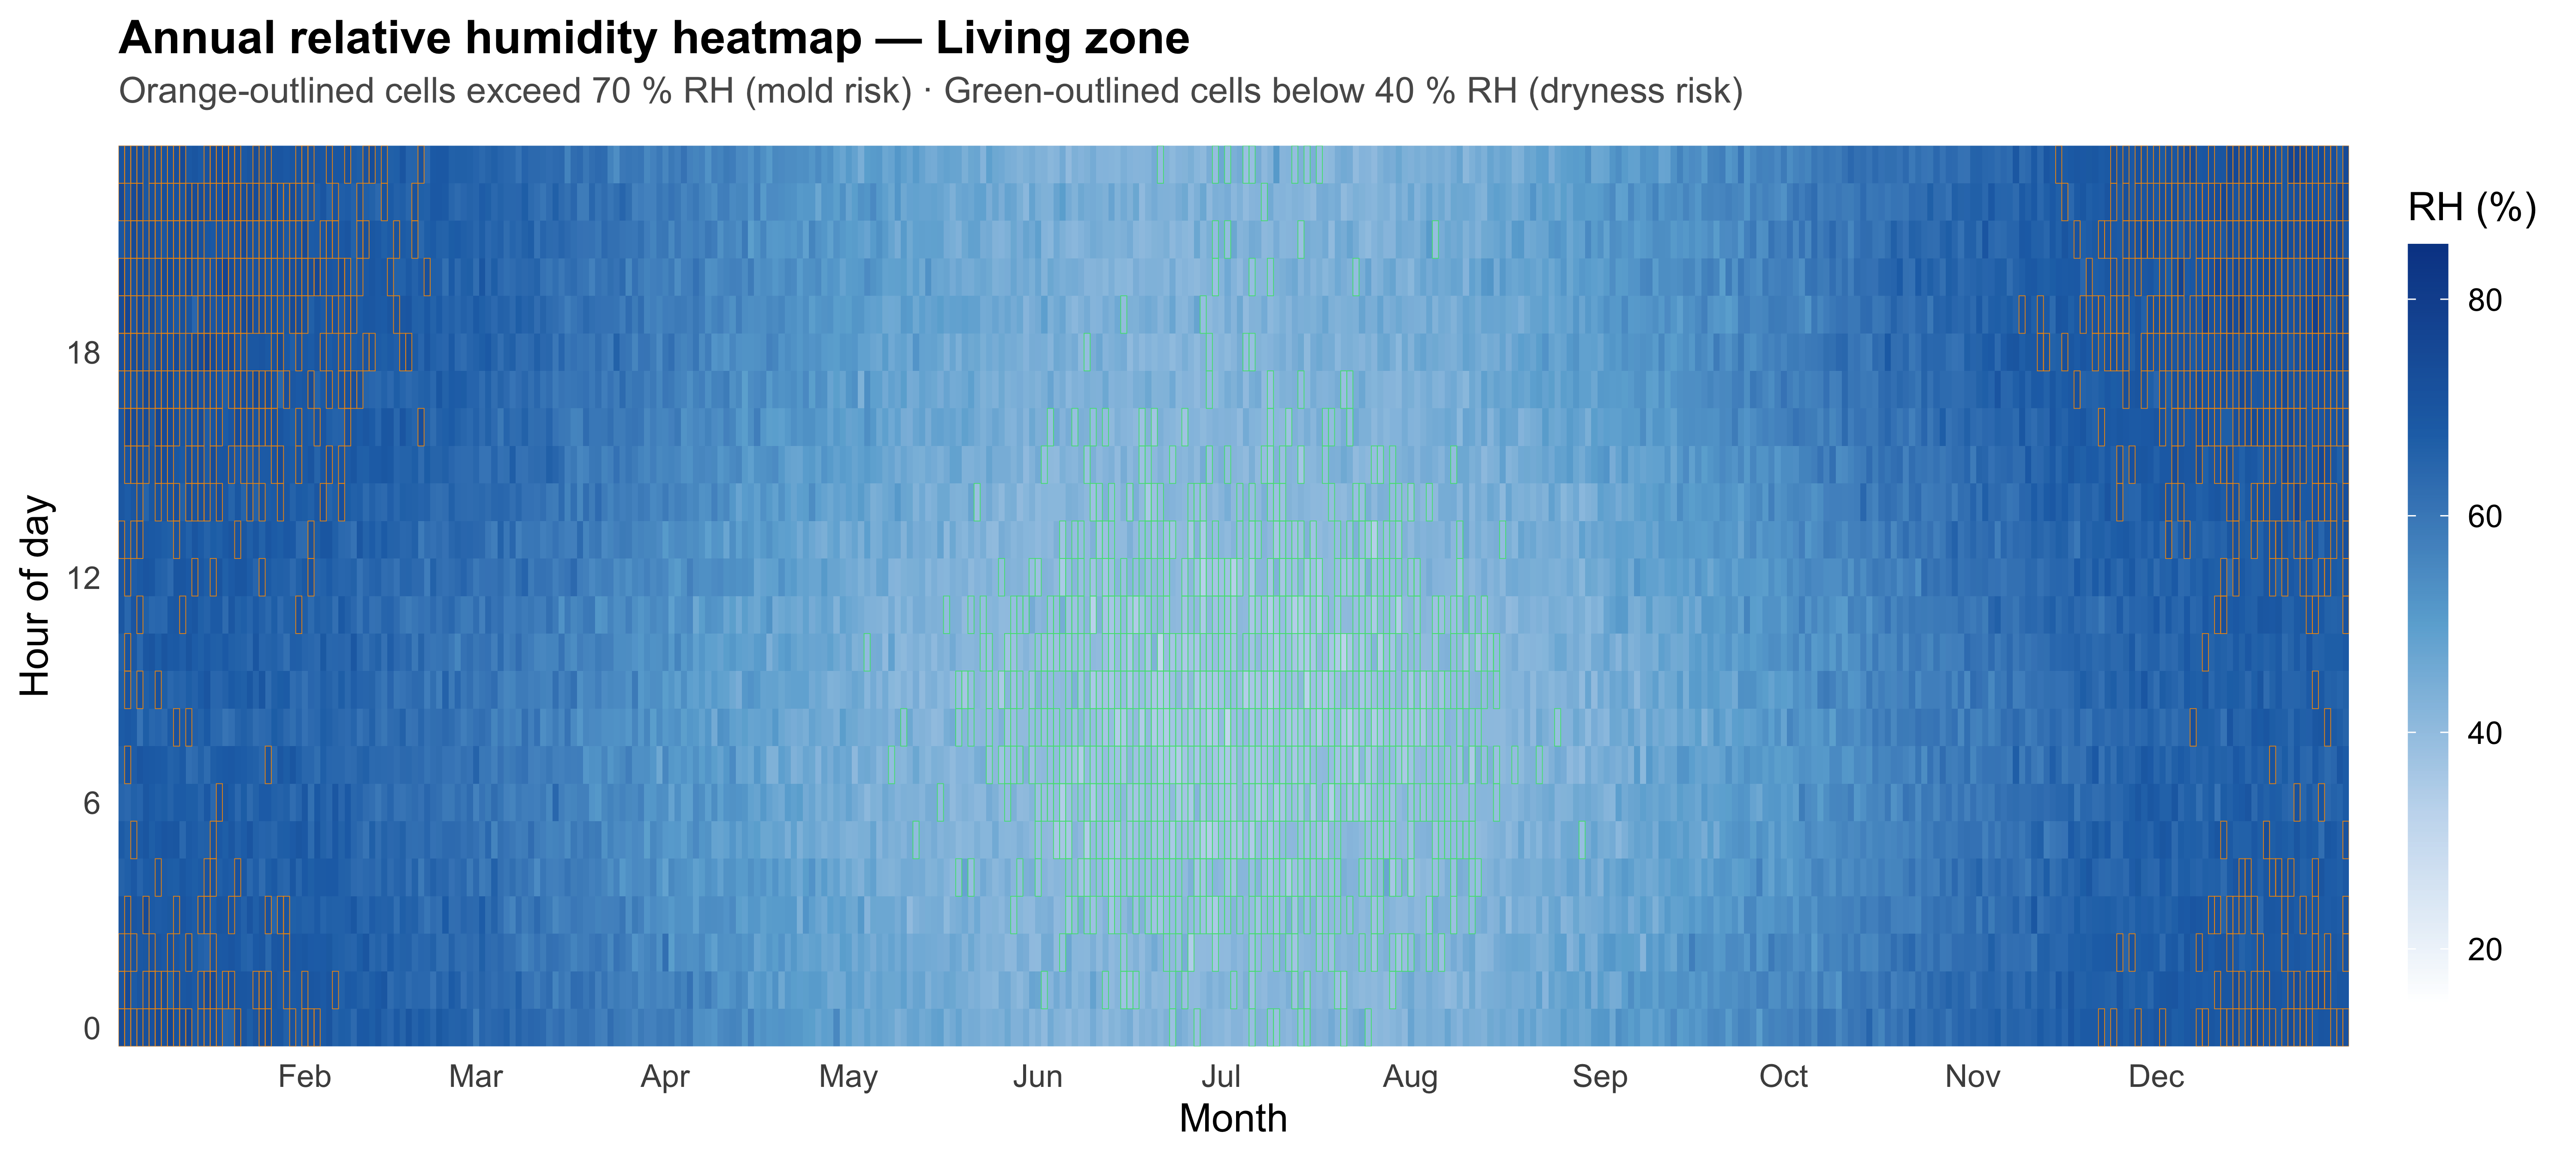
Full-year hourly heatmap of indoor relative humidity with mold risk and dryness thresholds, from hourly timeseries data.
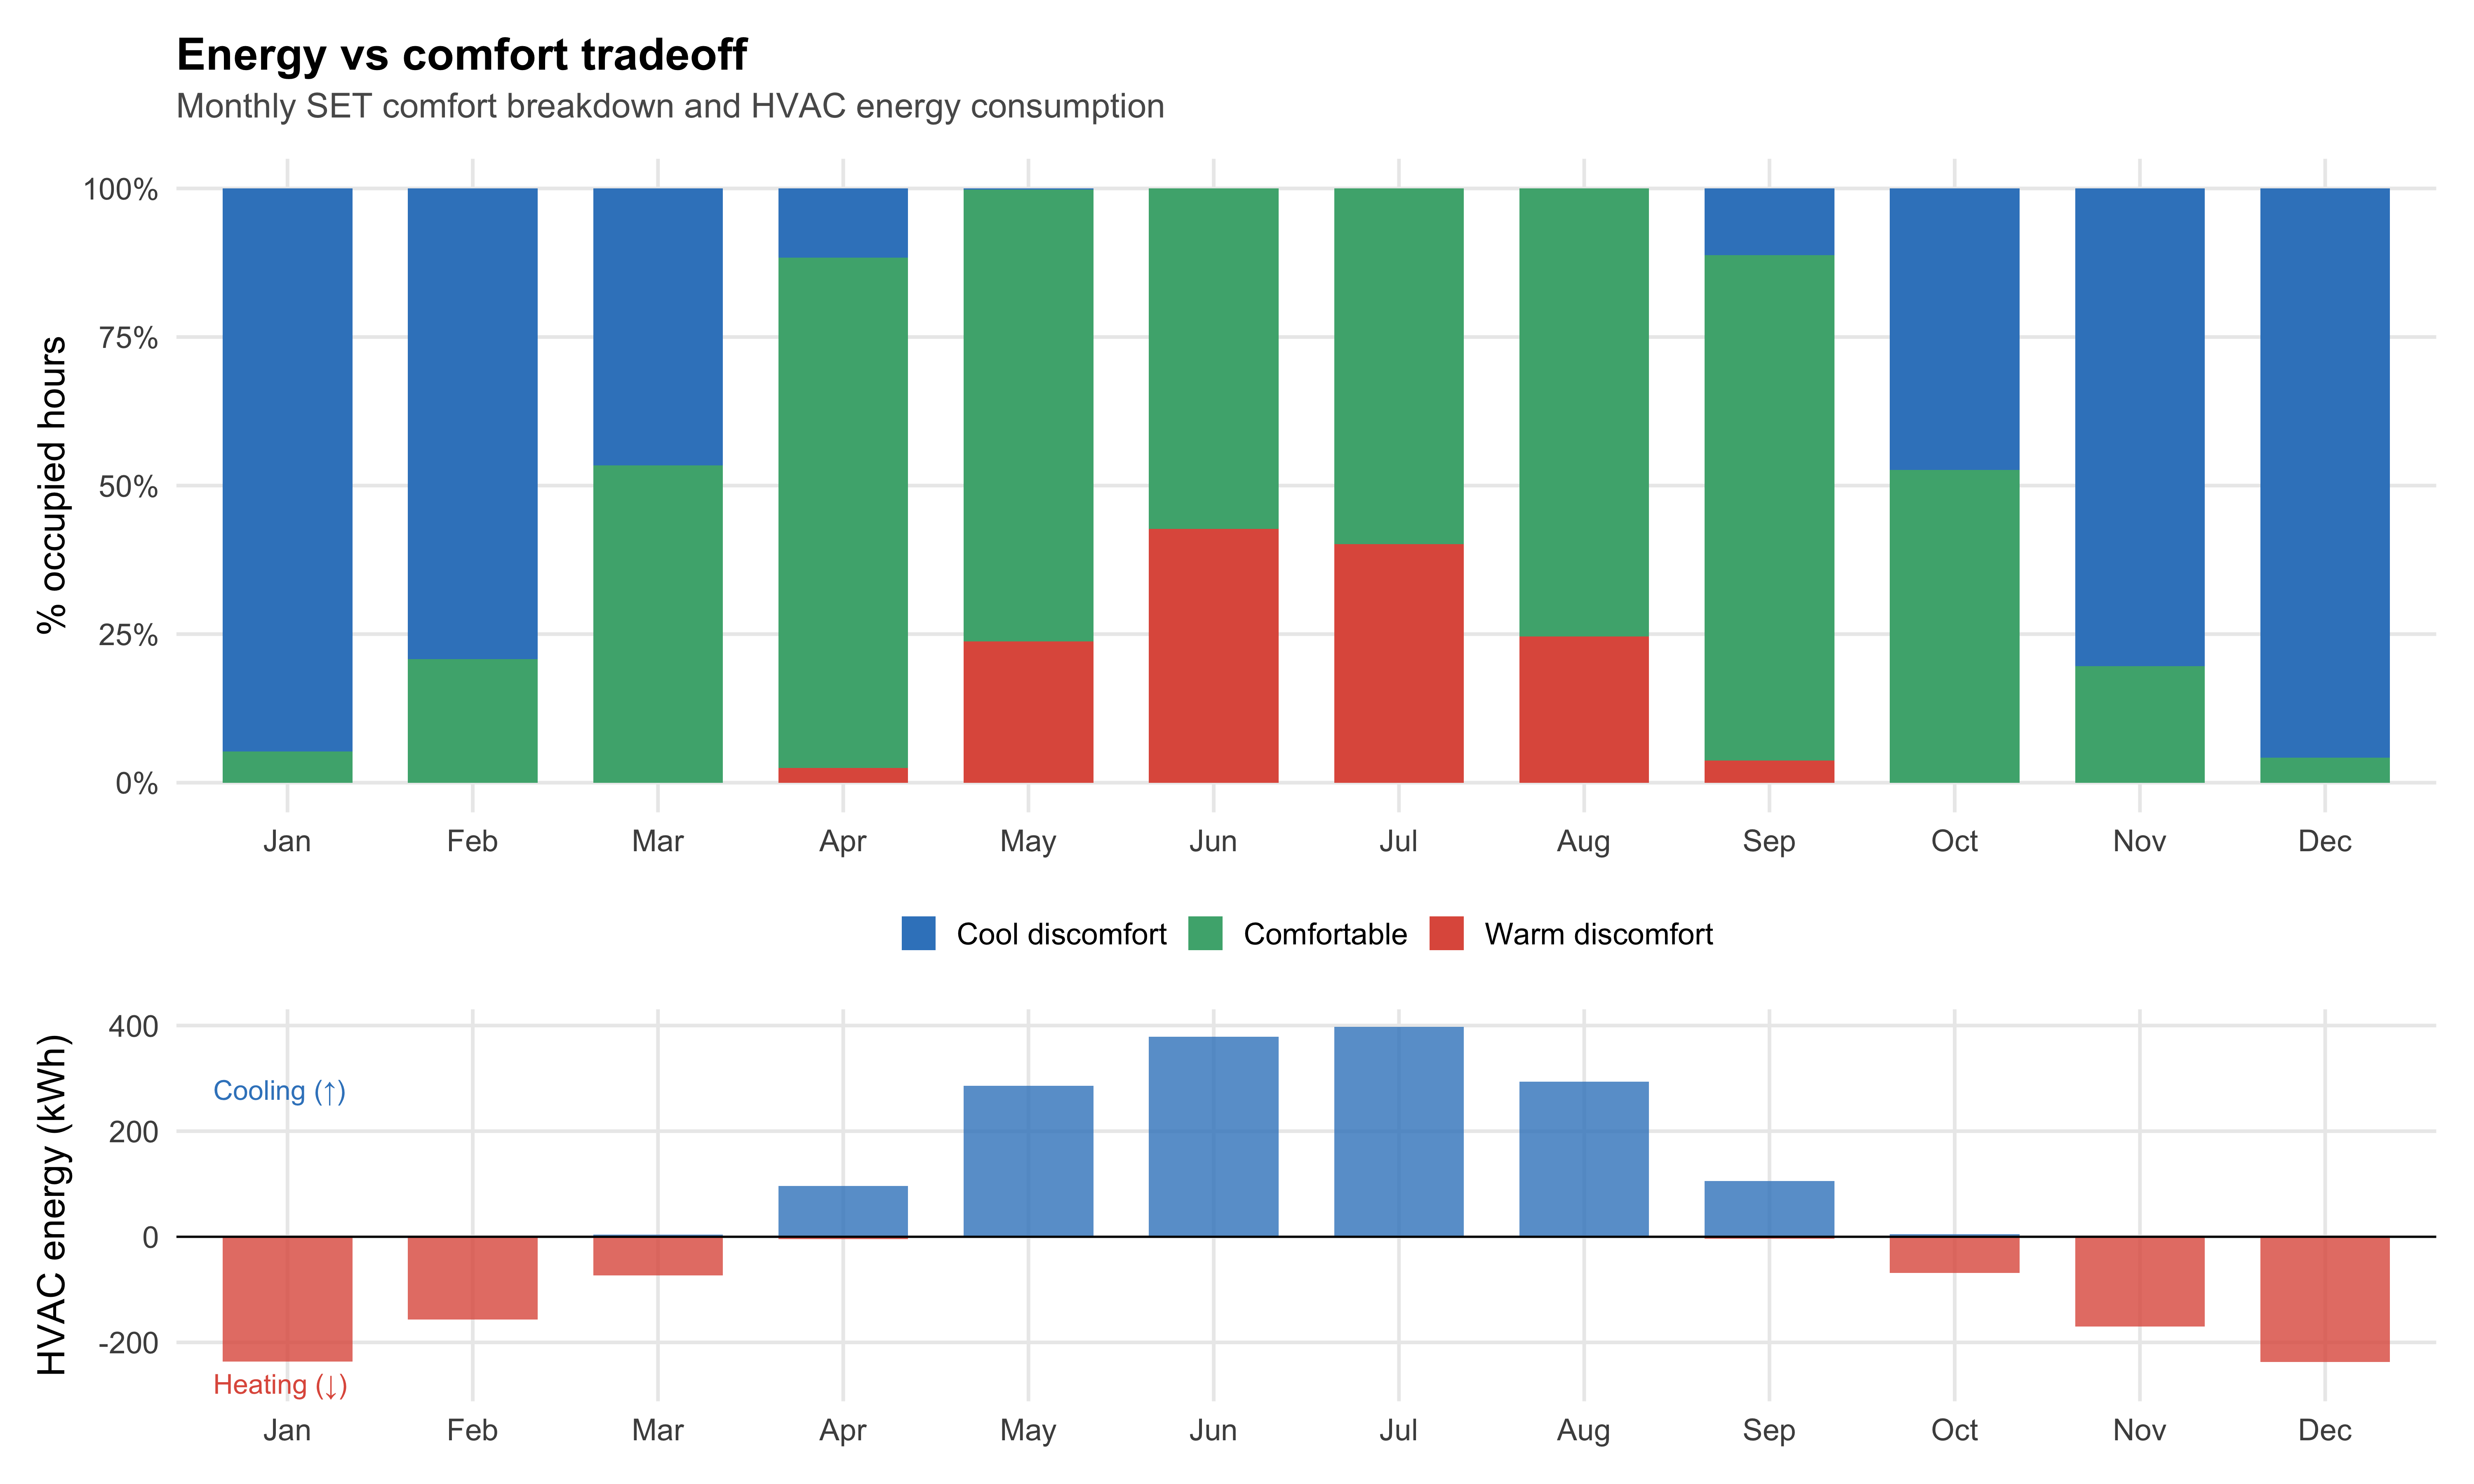
Monthly SET comfort breakdown paired with a diverging HVAC energy bar chart, linking thermal comfort outcomes to cooling and heating energy consumption.
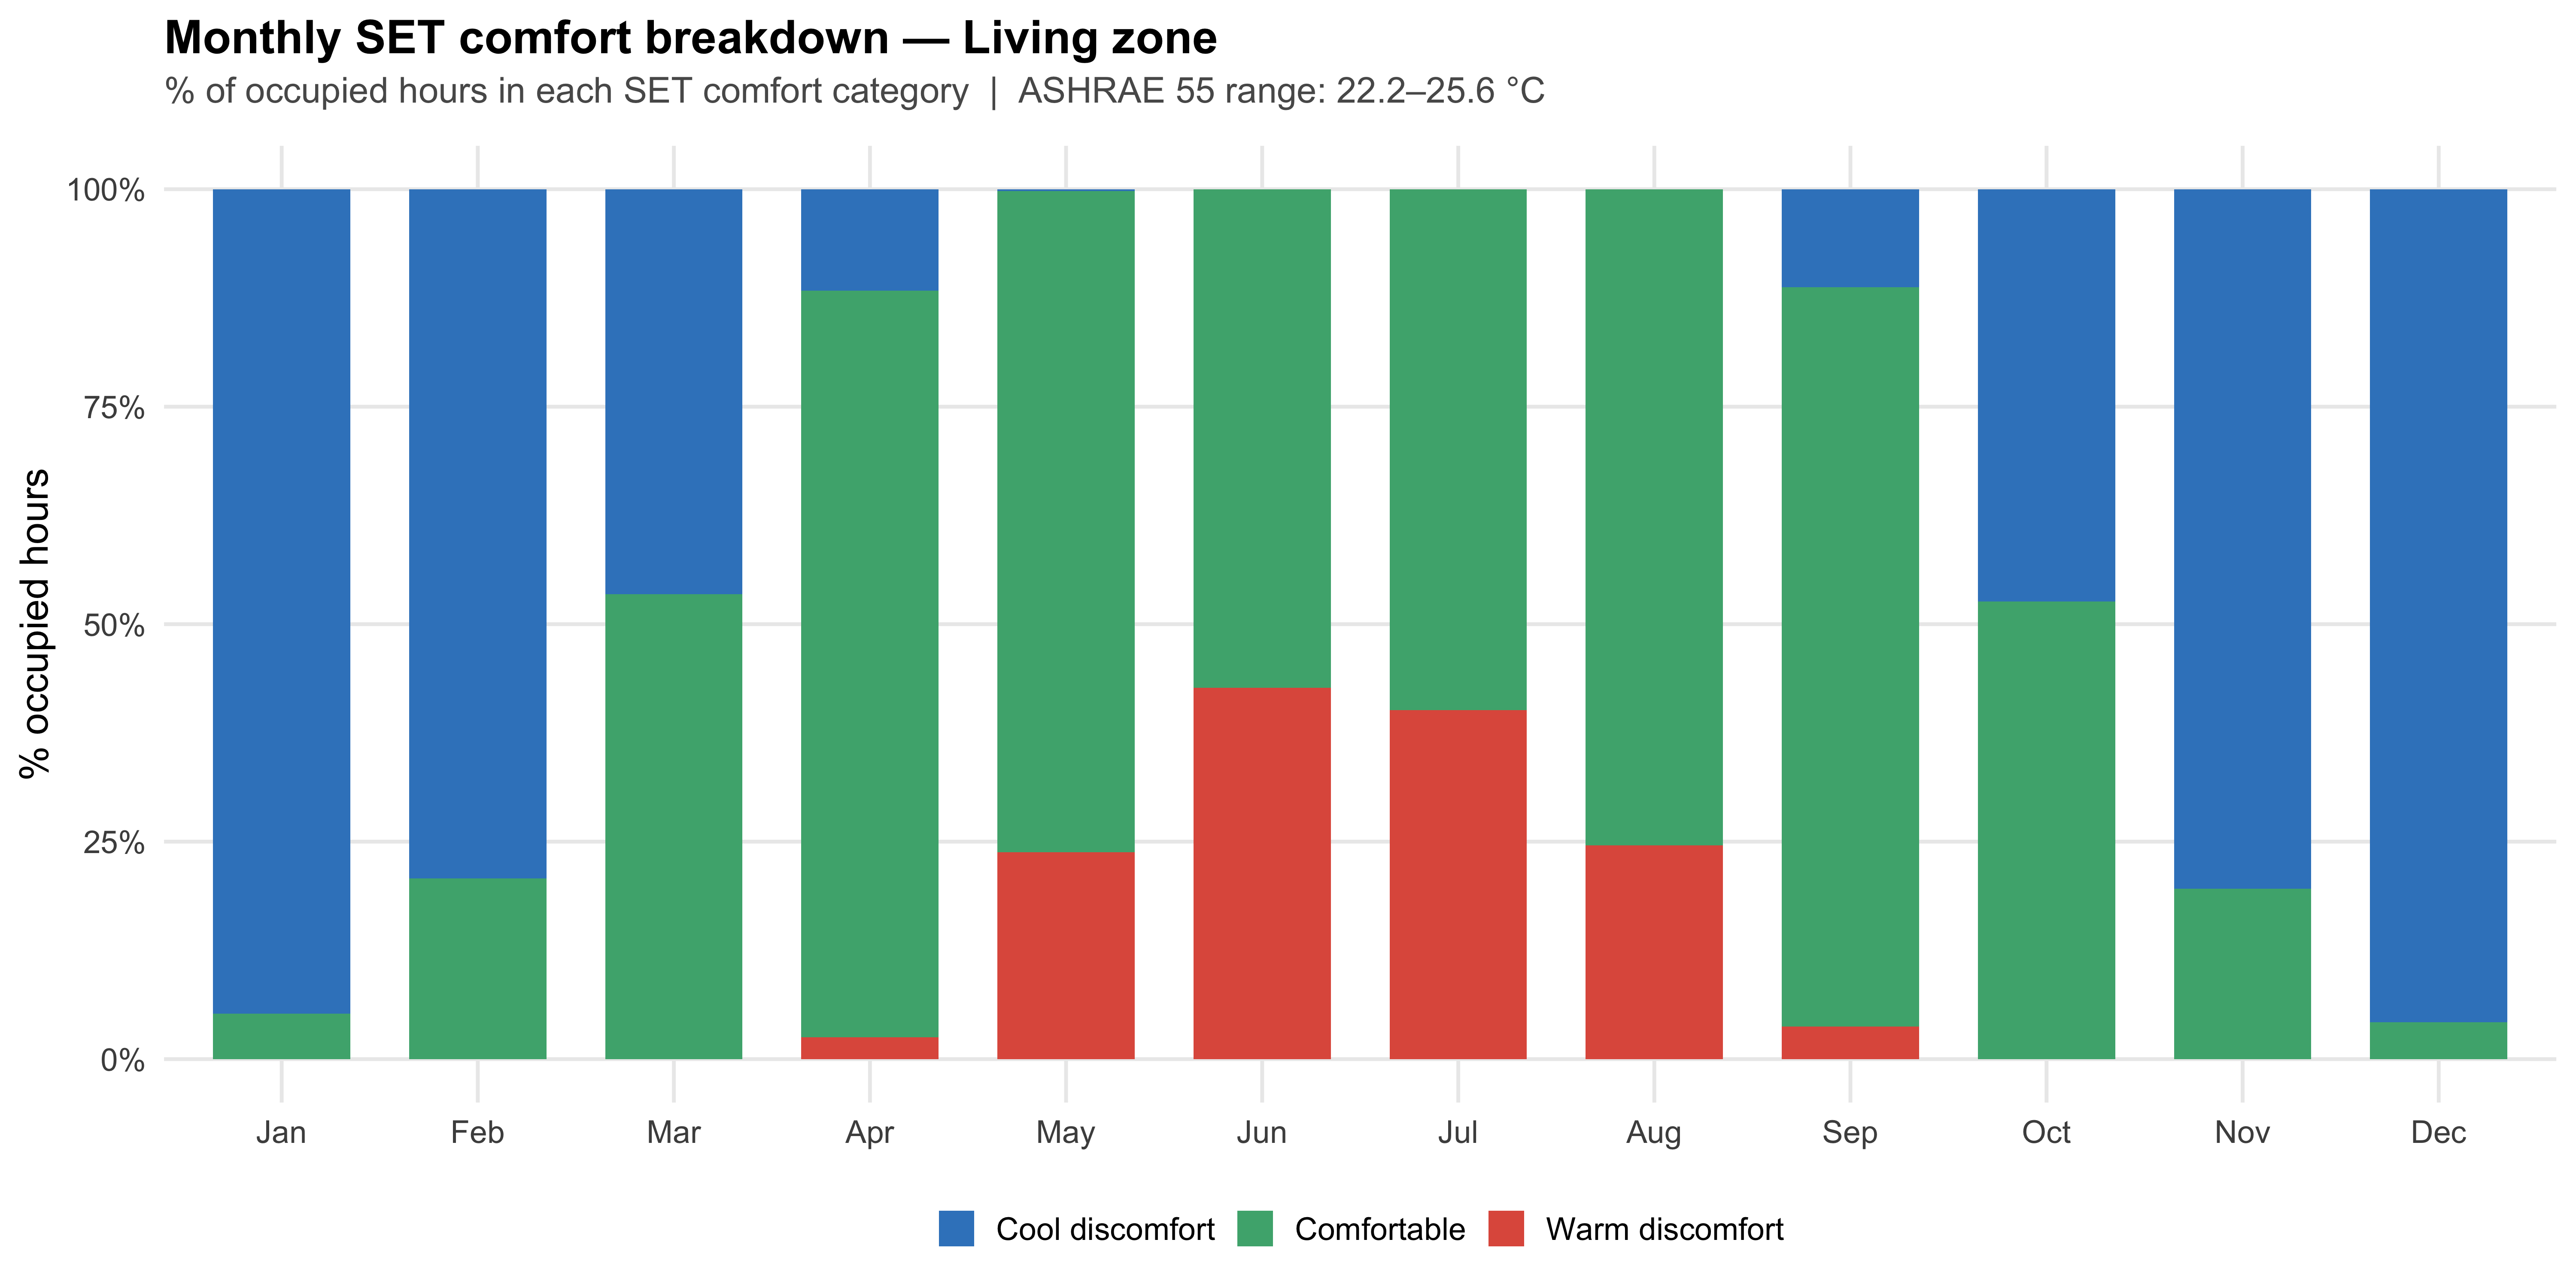
Stacked bar chart of occupied hours by Standard Effective Temperature (SET) comfort category across months.
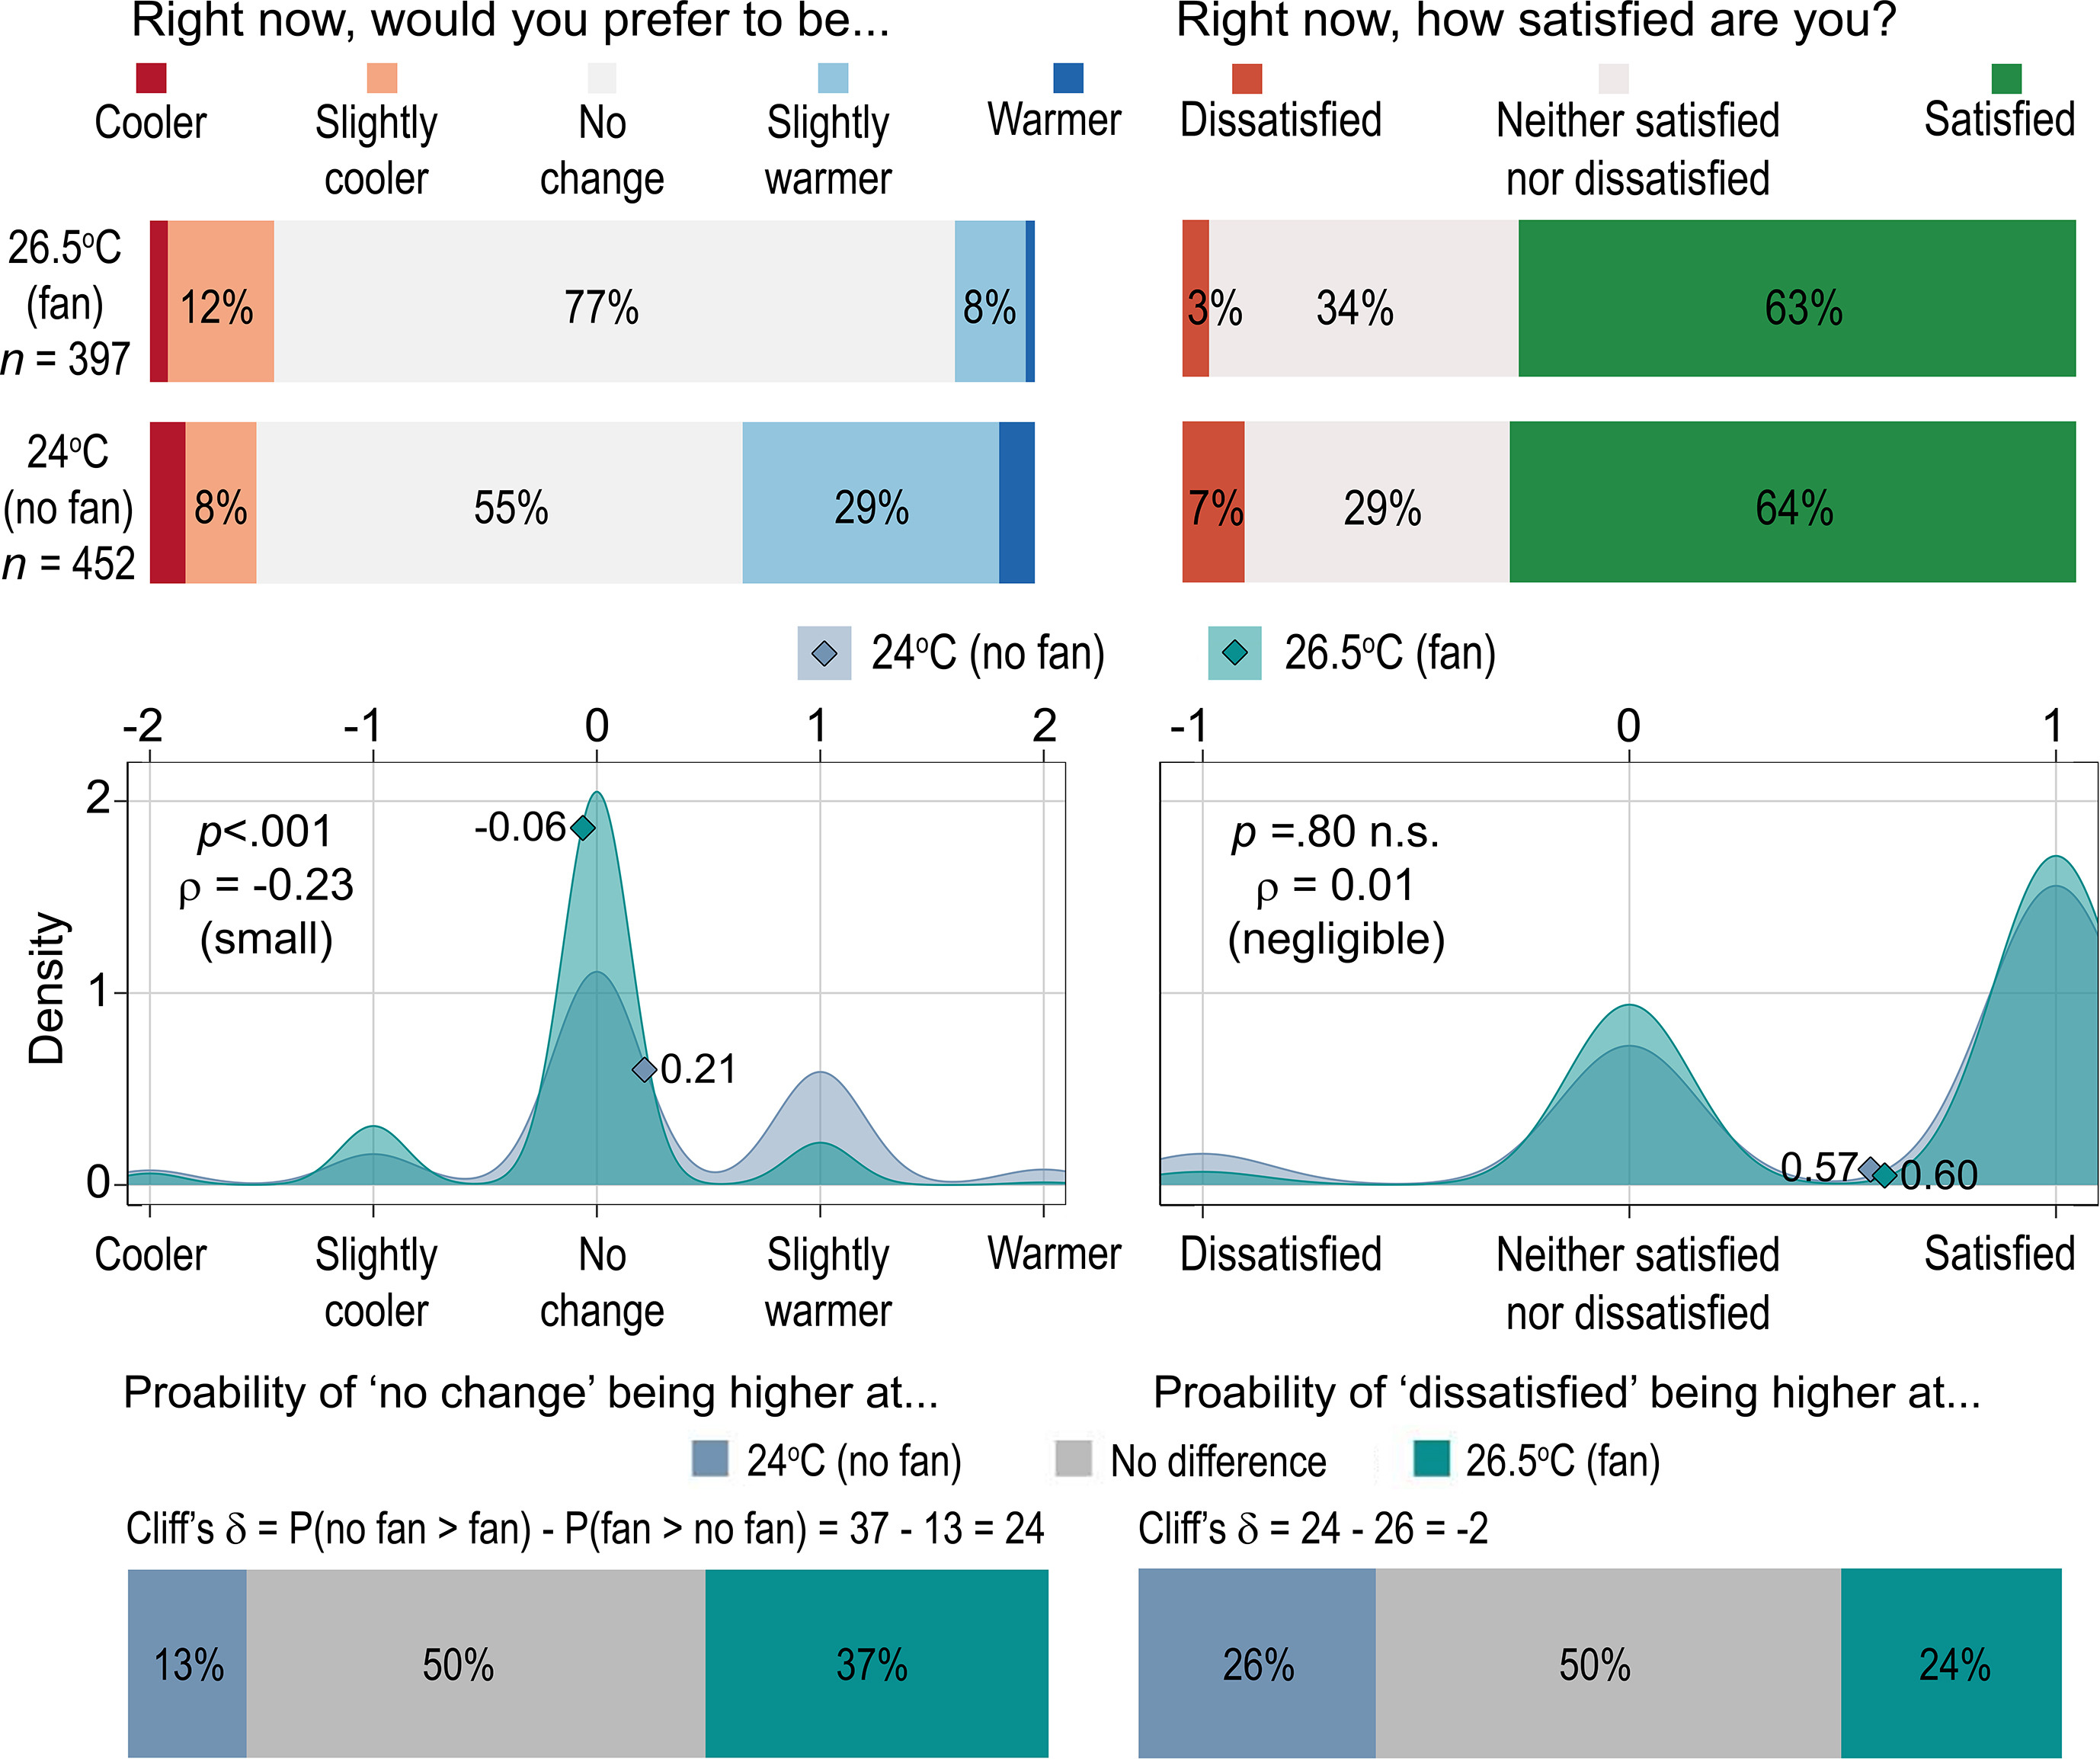
Plot comparing thermal satisfaction and thermal preference at different conditions.
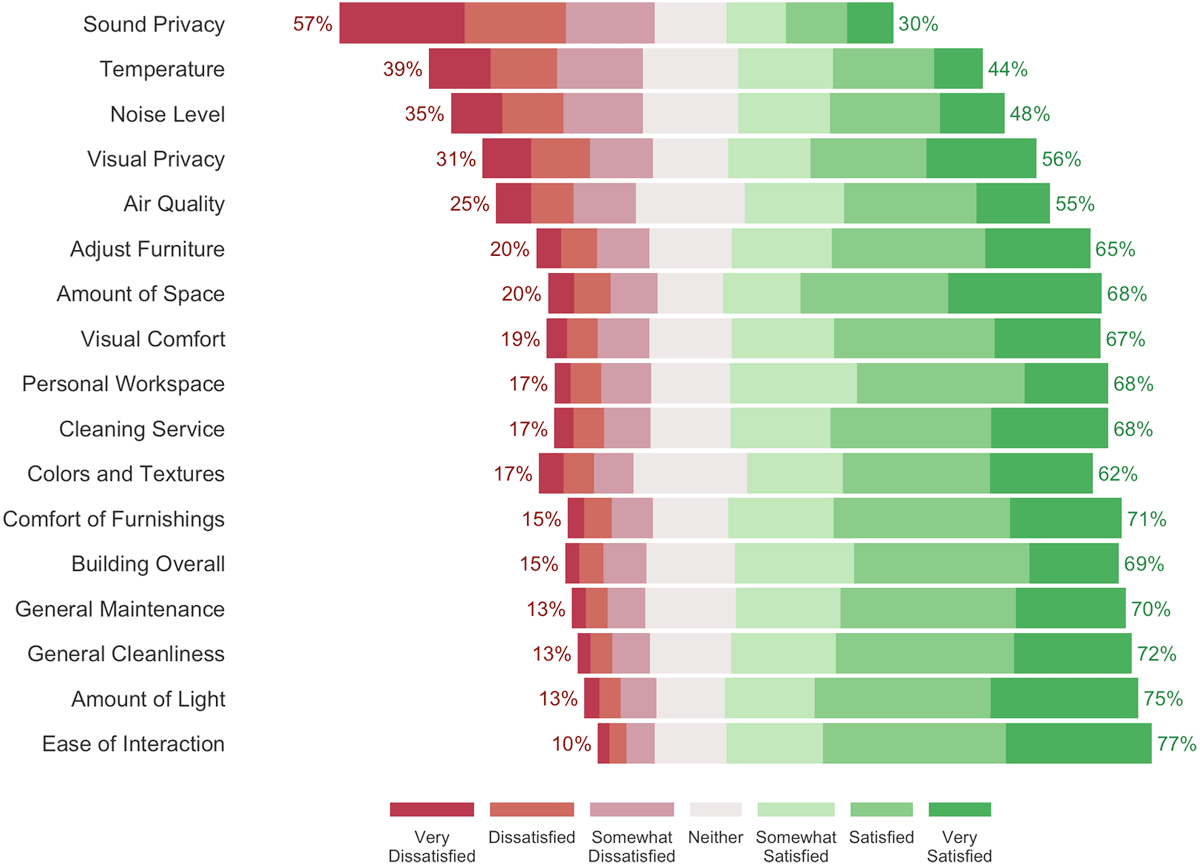
Standard CBE plot to visualize satisfaction with IEQ parameters.
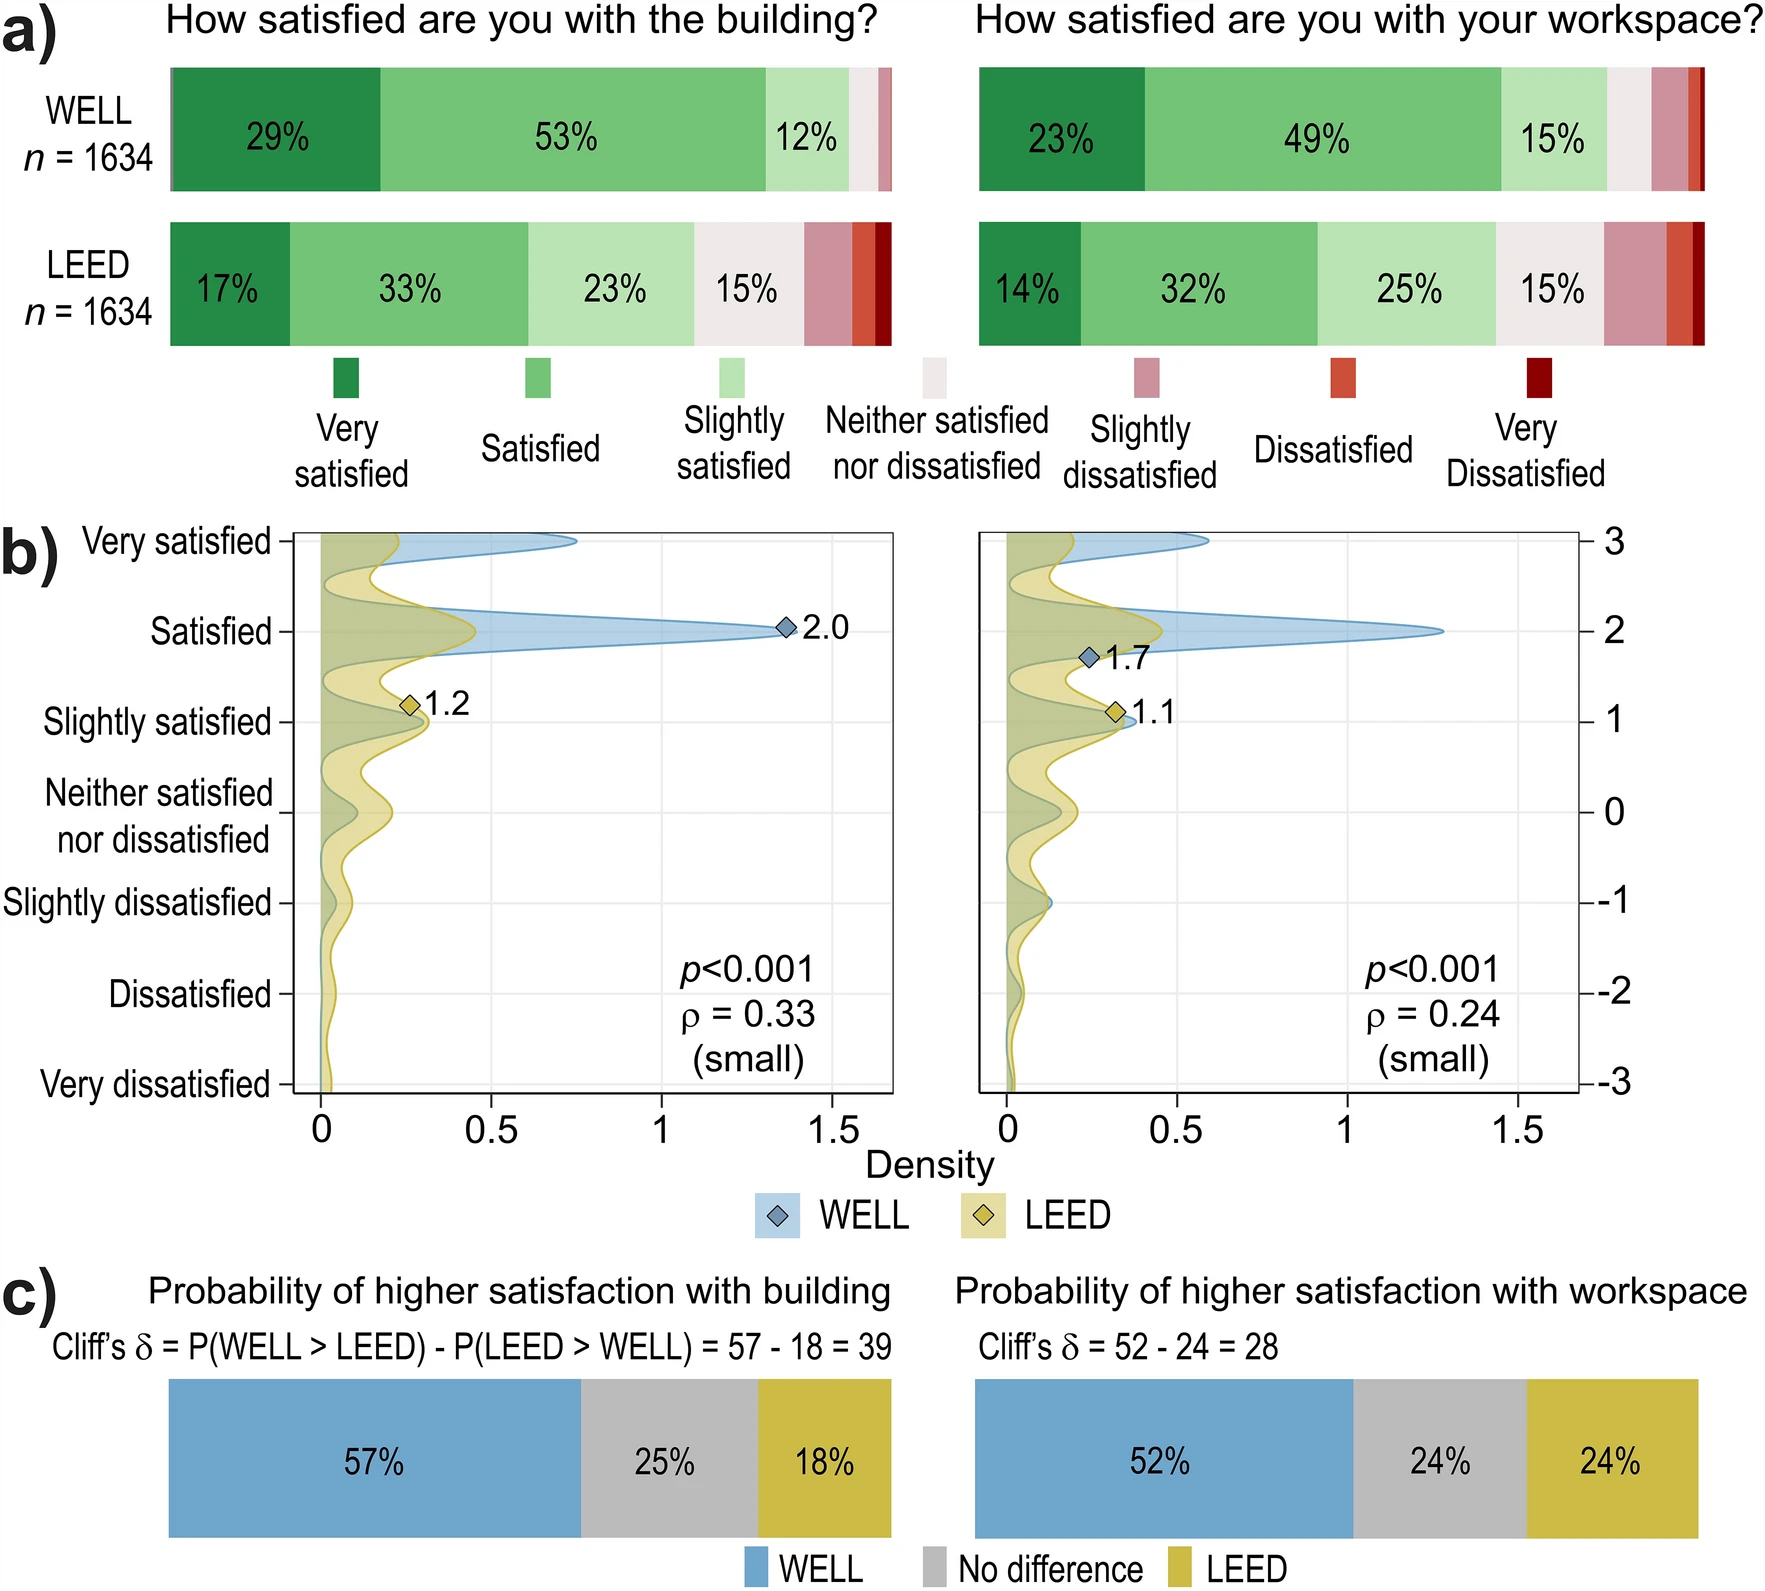
Plot comparing thermal satisfaction in different building categories.
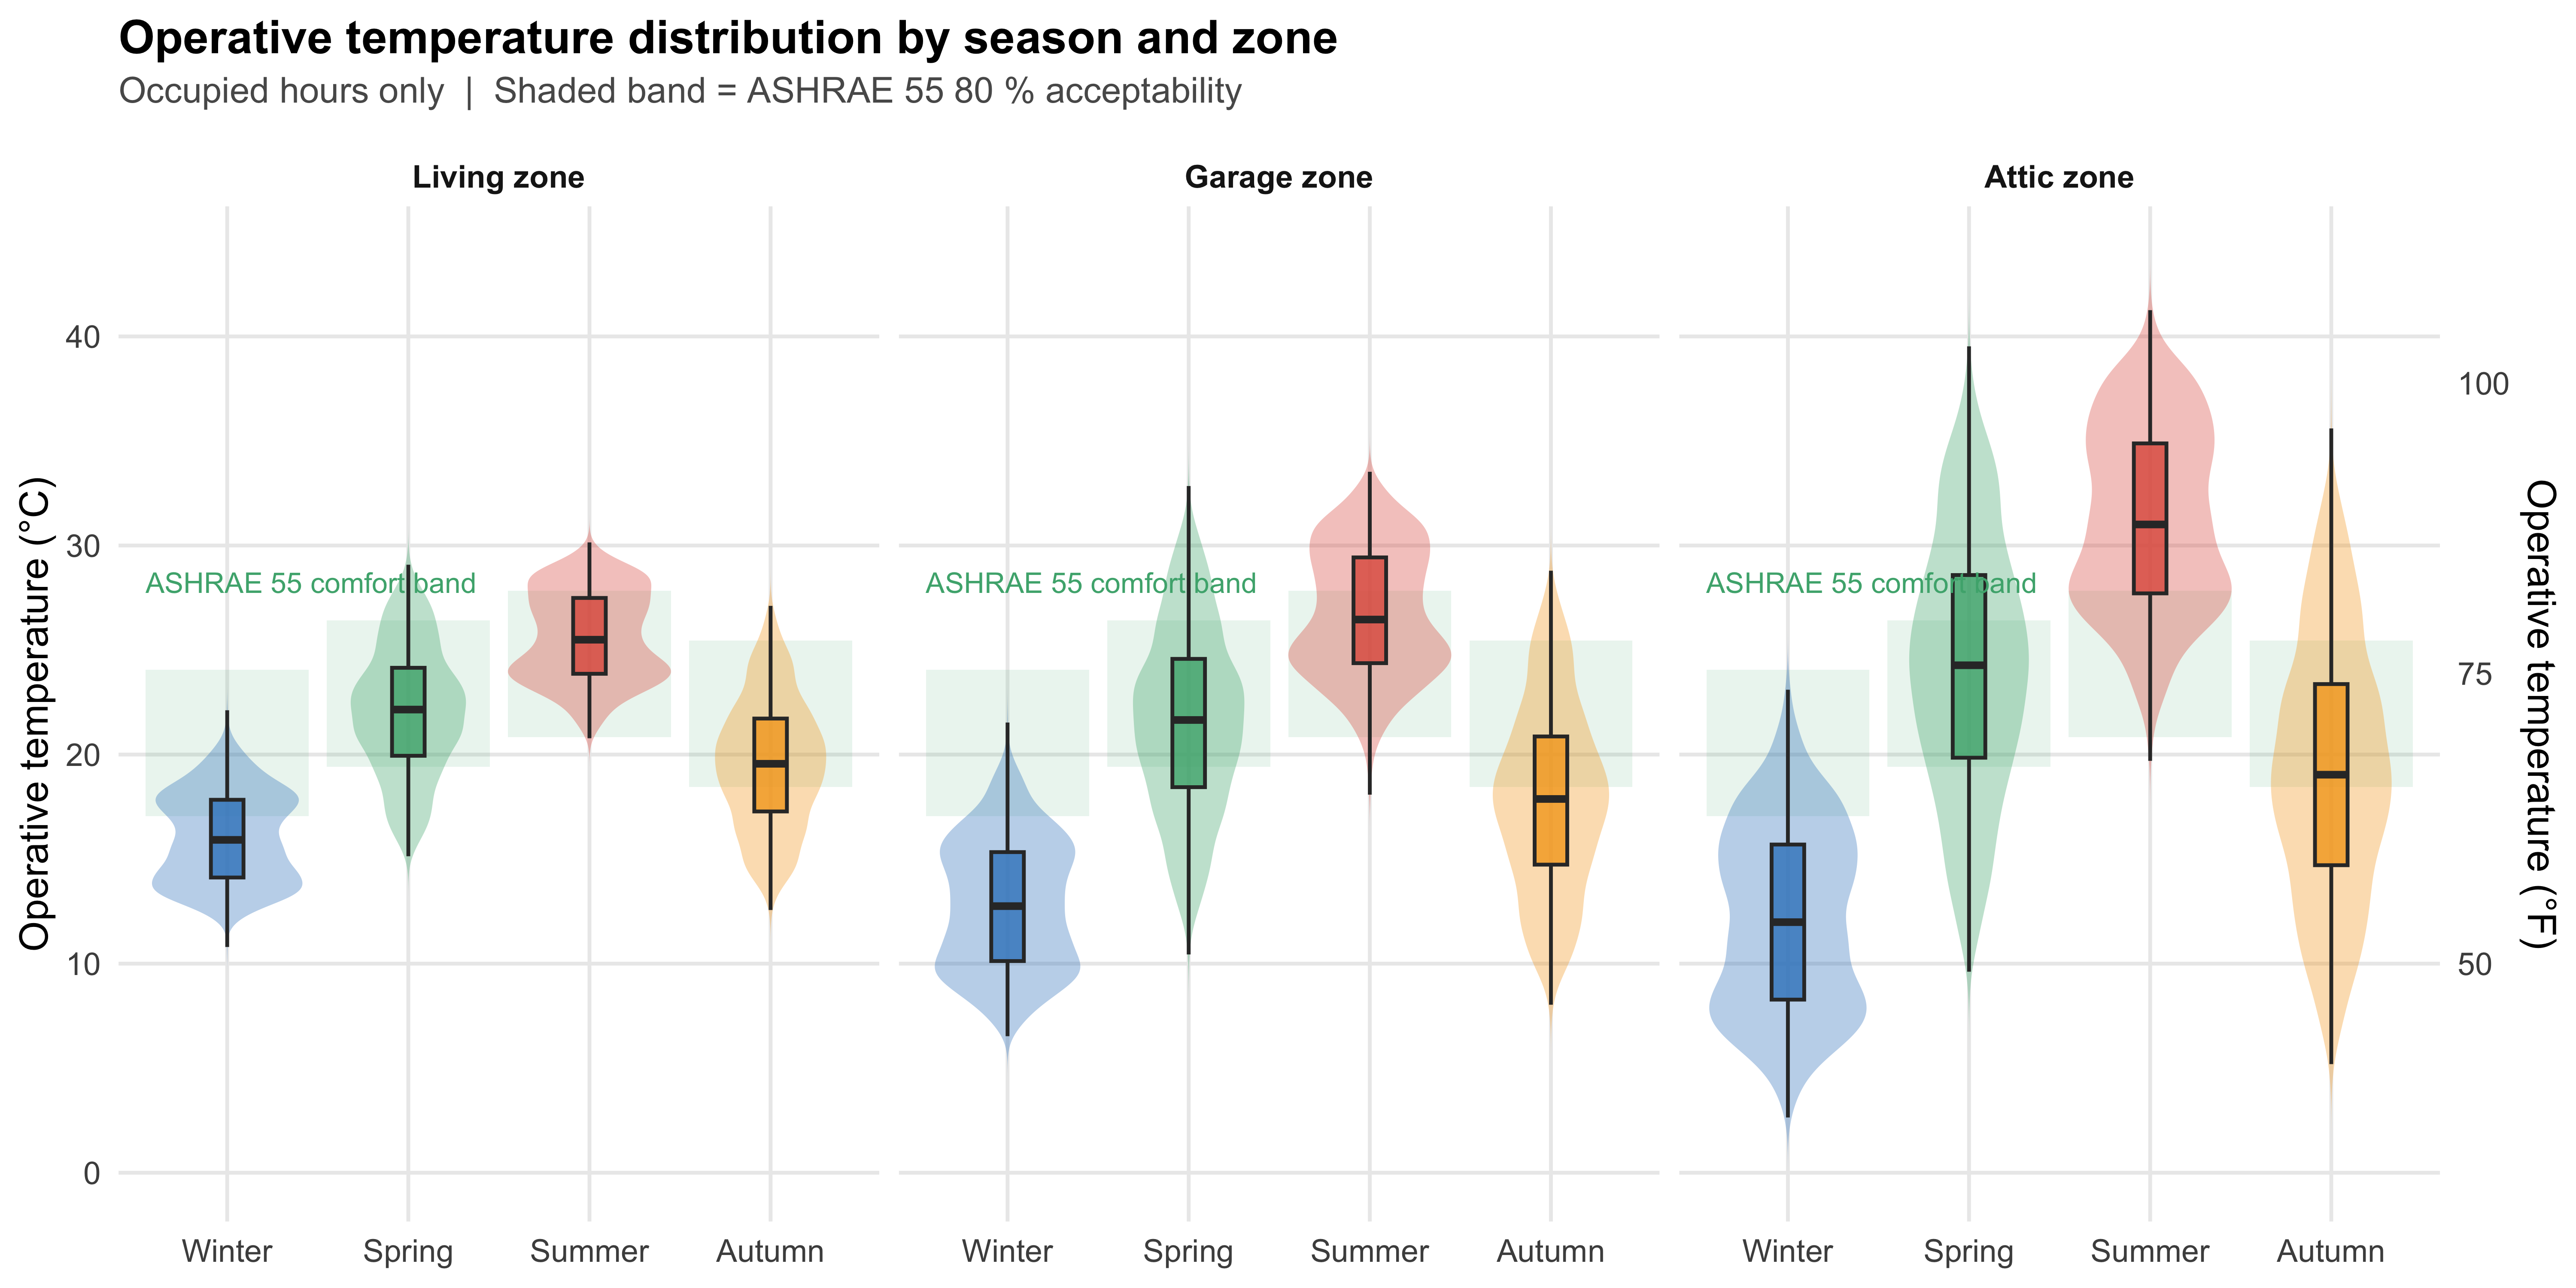
Violin-boxplot of operative temperature during occupied hours by season and thermal zone, with ASHRAE 55 adaptive comfort band overlay.
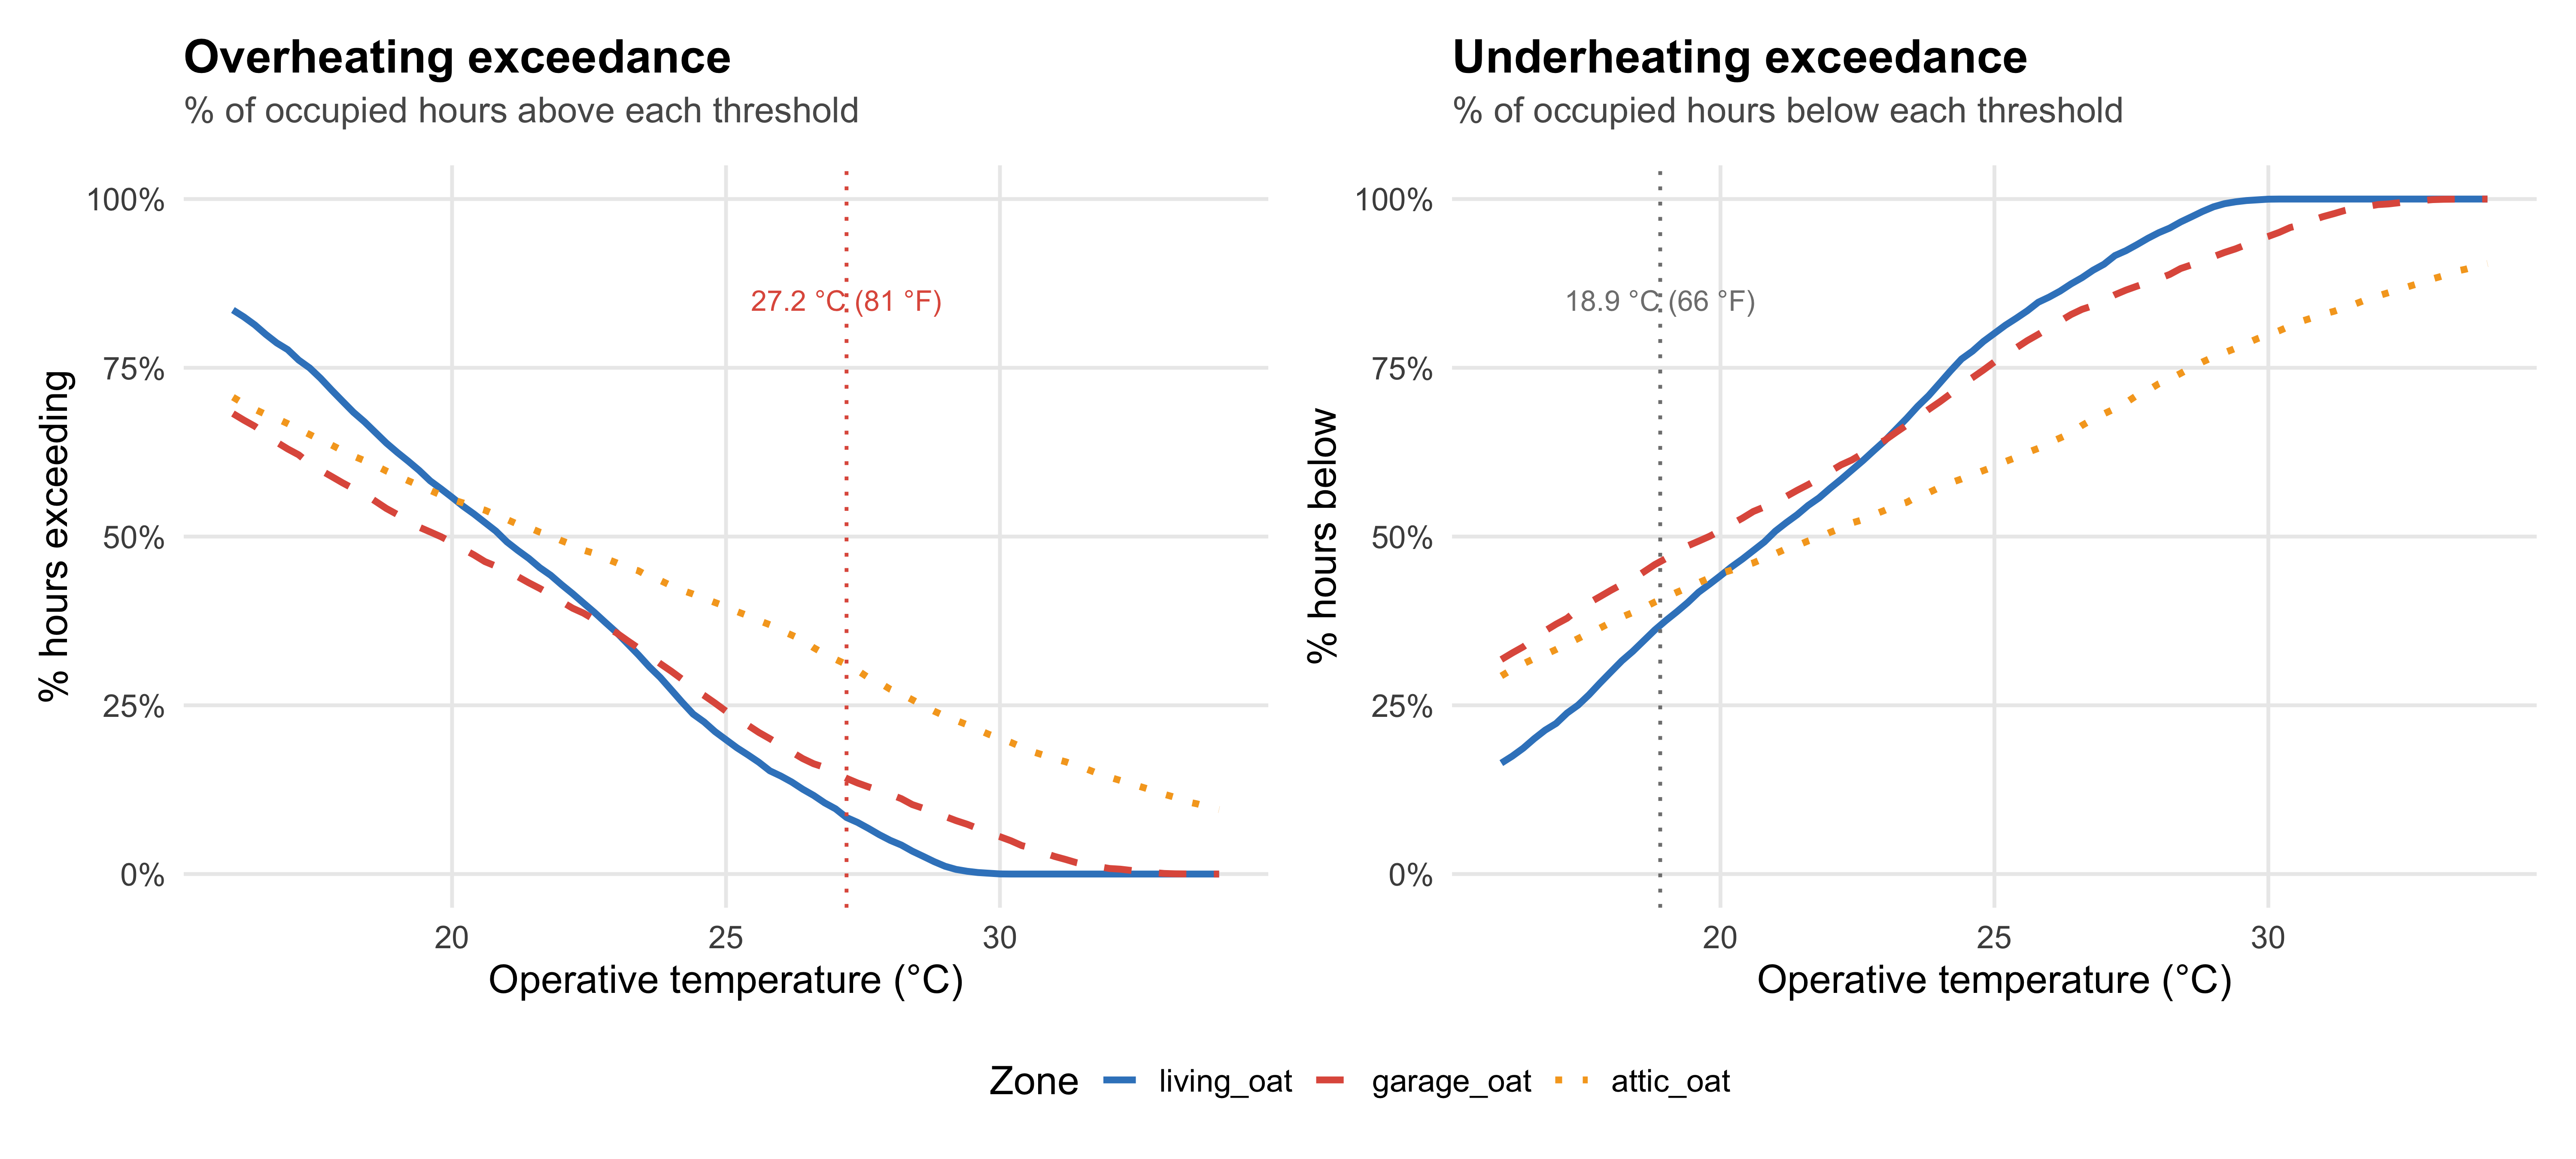
Complementary cumulative distribution of operative temperature by zone, showing the percentage of occupied hours above or below comfort thresholds.
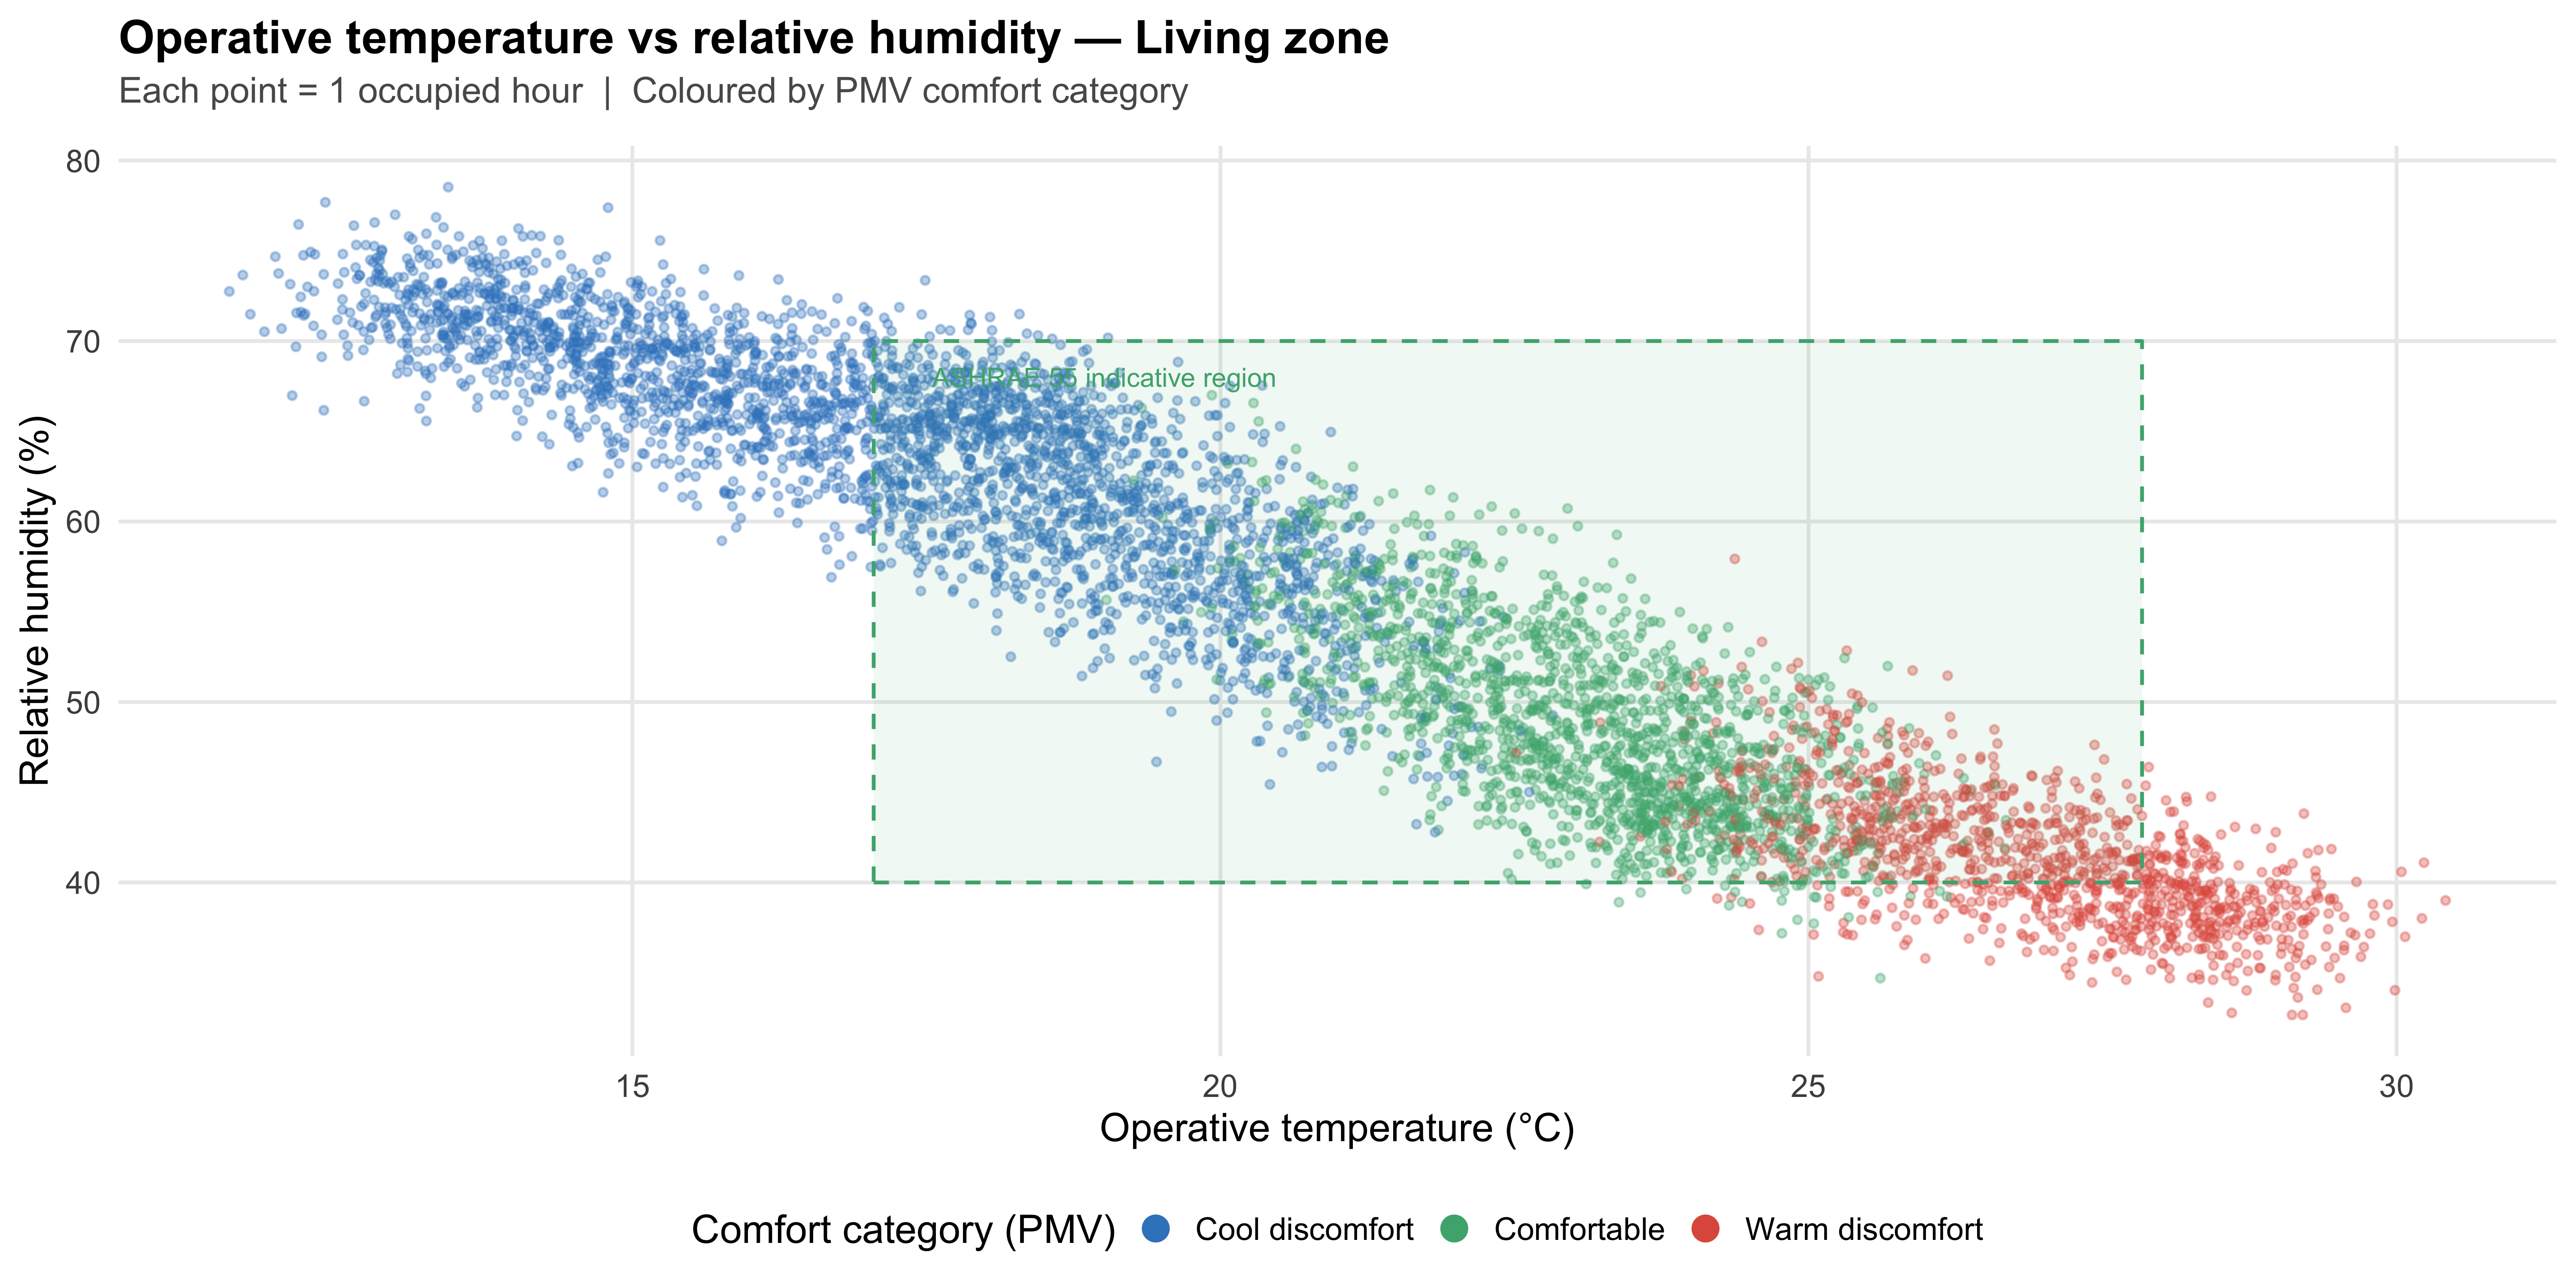
Occupied-hour scatter of operative temperature versus relative humidity, coloured by PMV comfort category, with an ASHRAE 55 adaptive comfort region overlay.
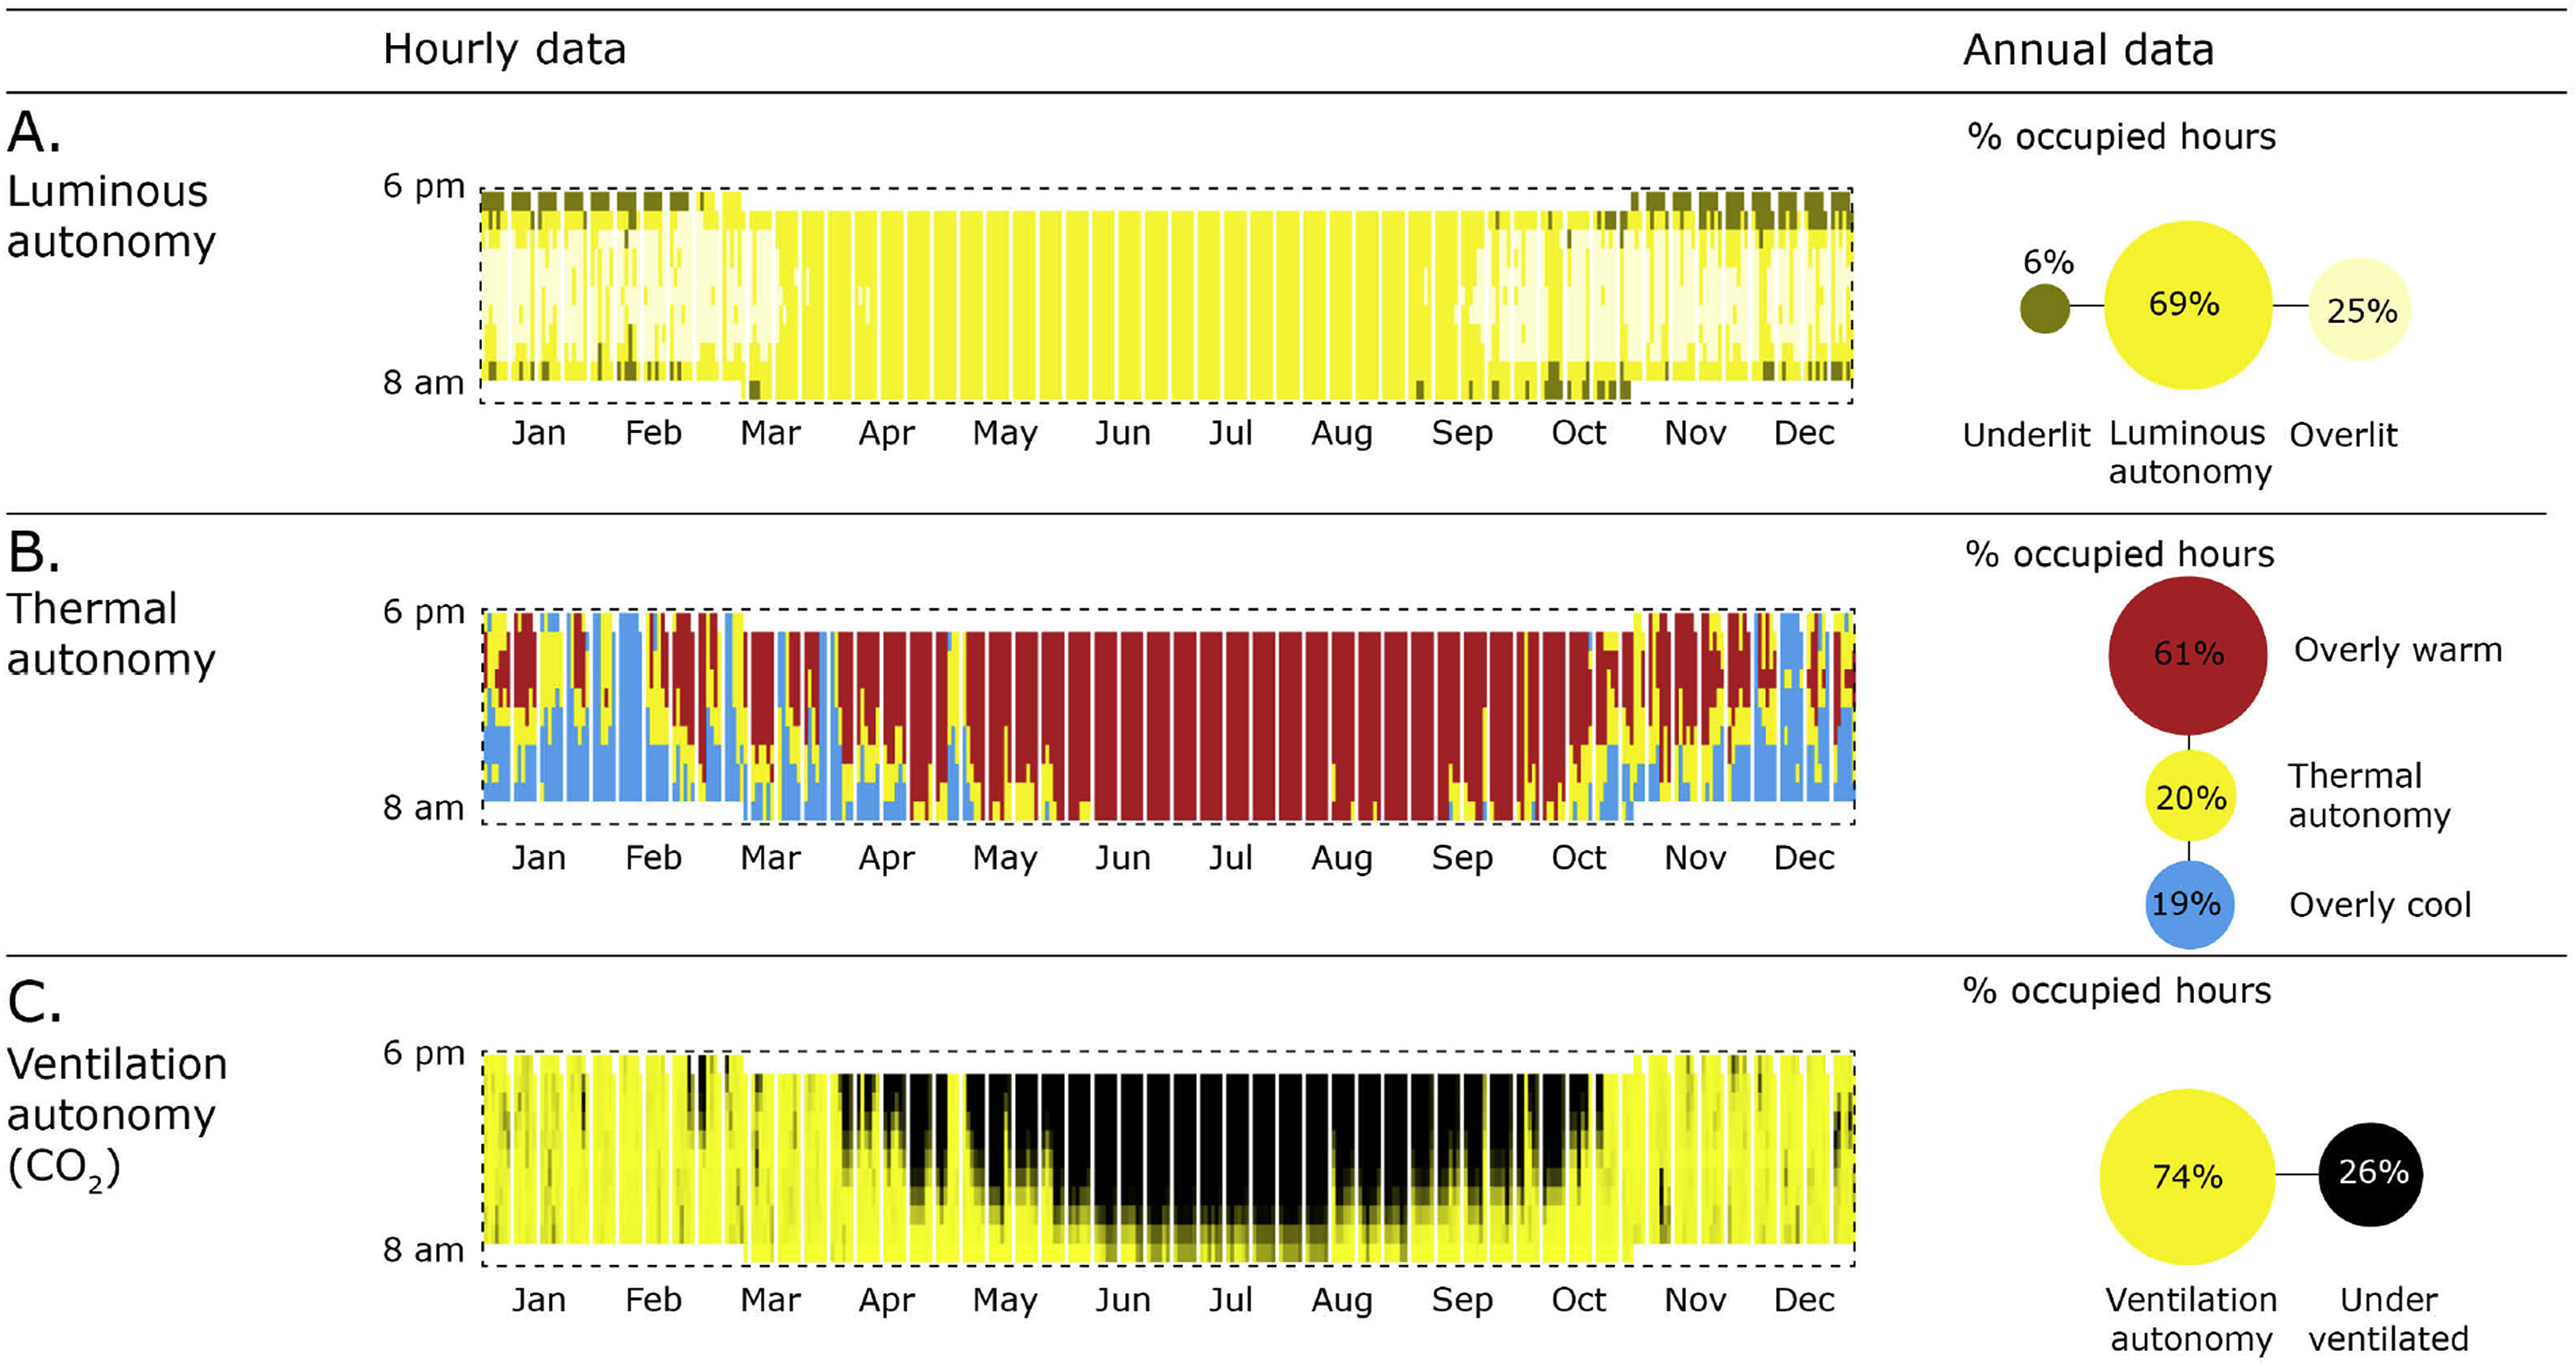
Hourly autonomy map and annual summary for luminous autonomy, thermal autonomy, and ventilation autonomy.
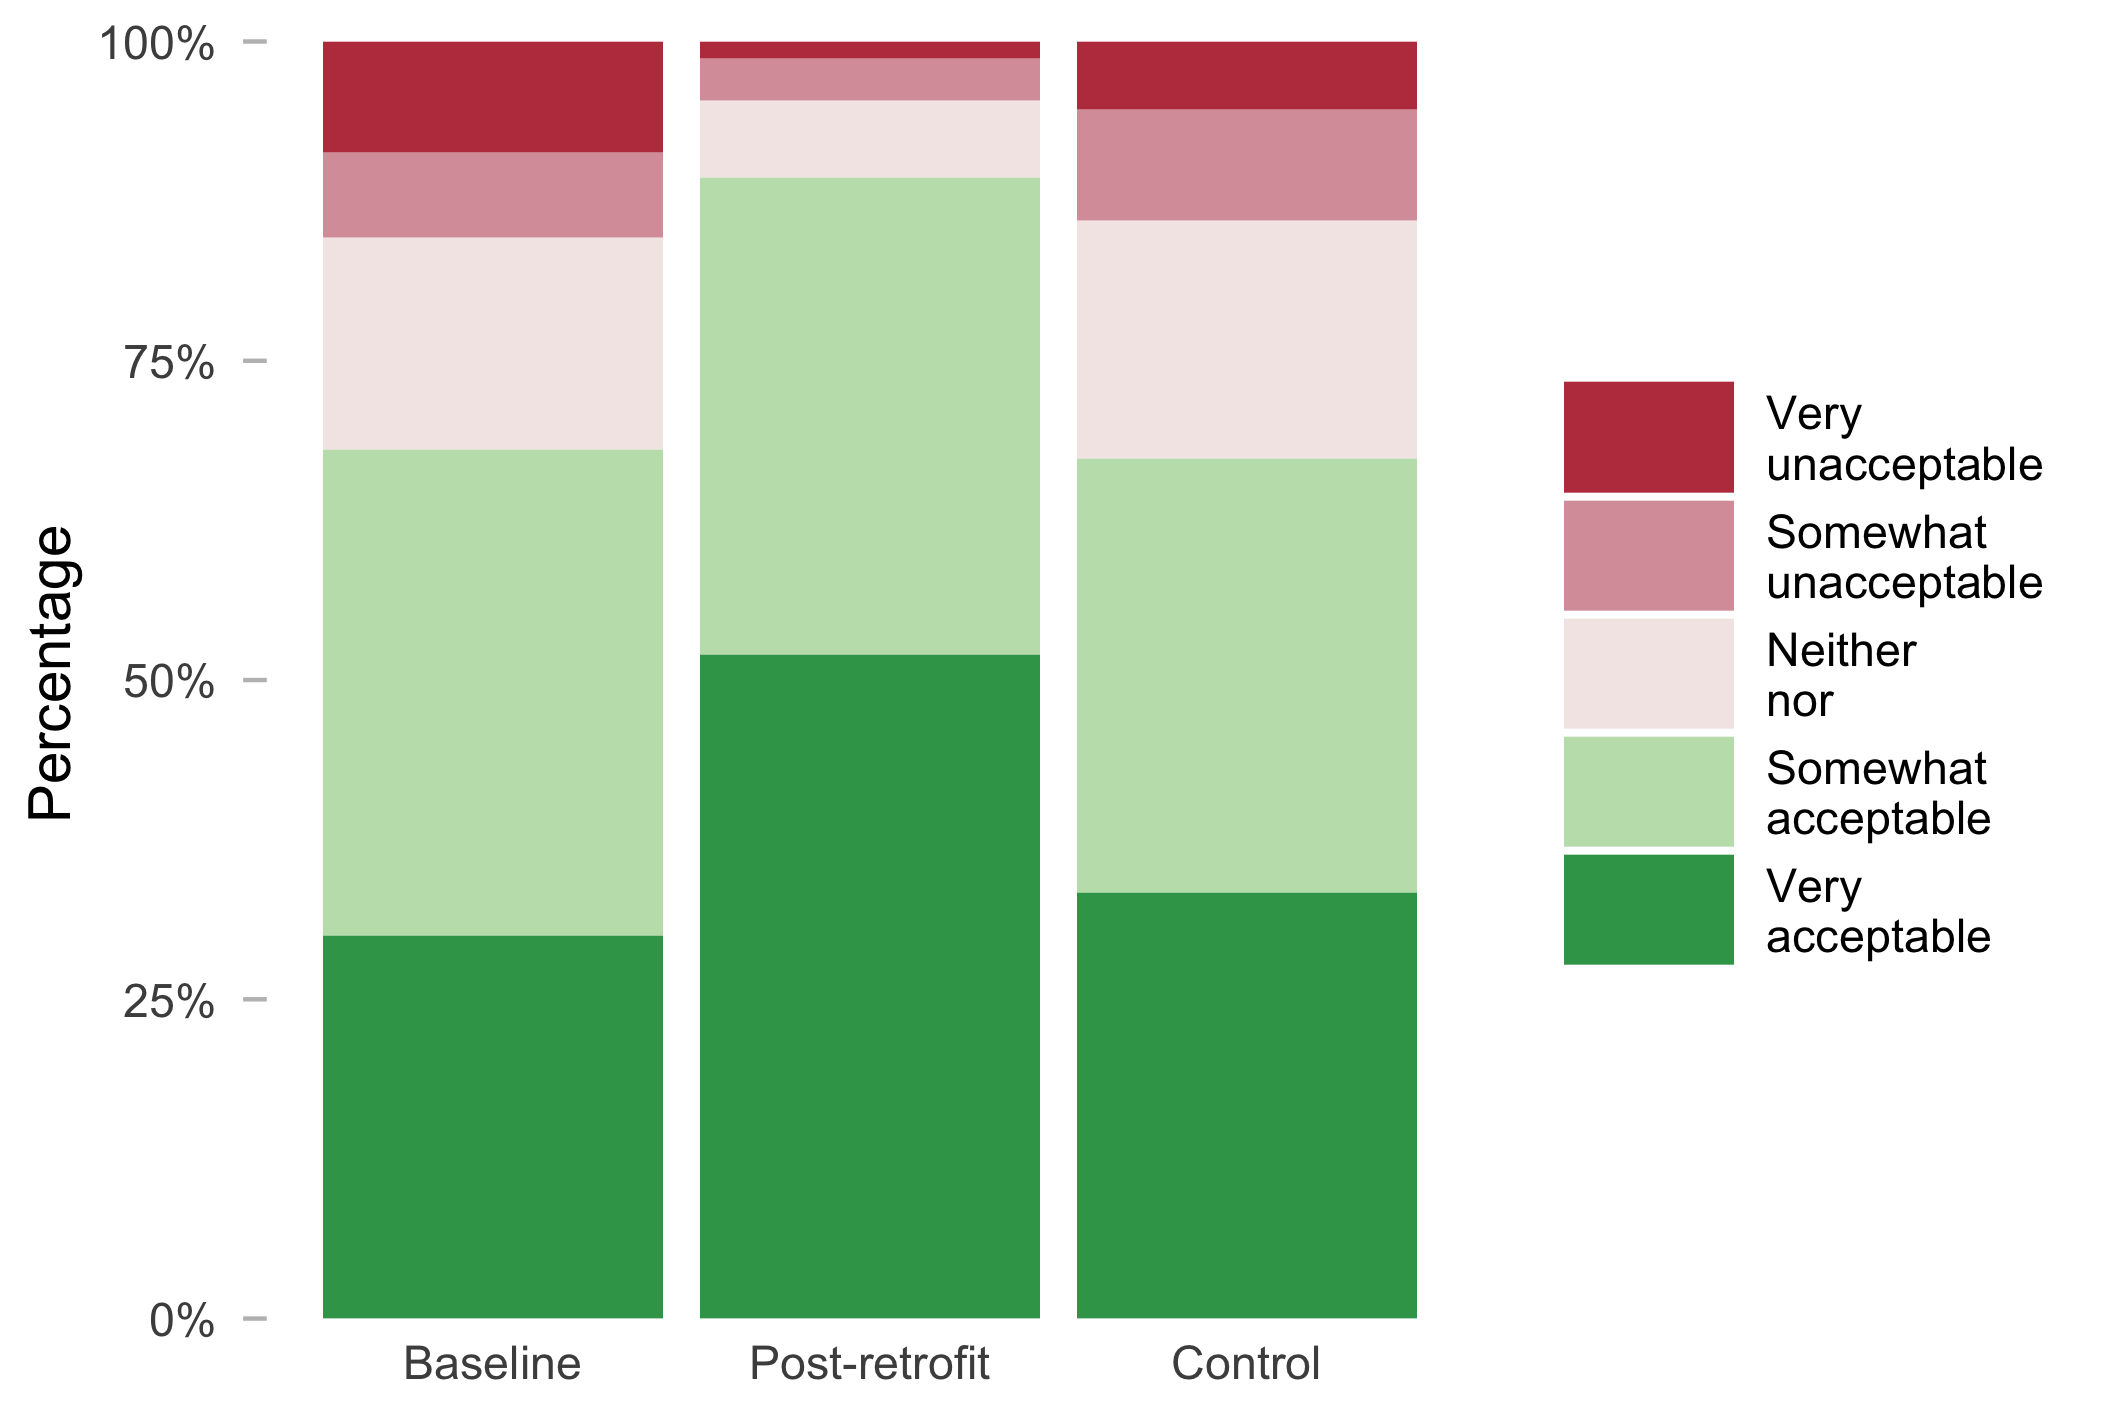
Distribution of thermal acceptability votes, e.g from survey data.
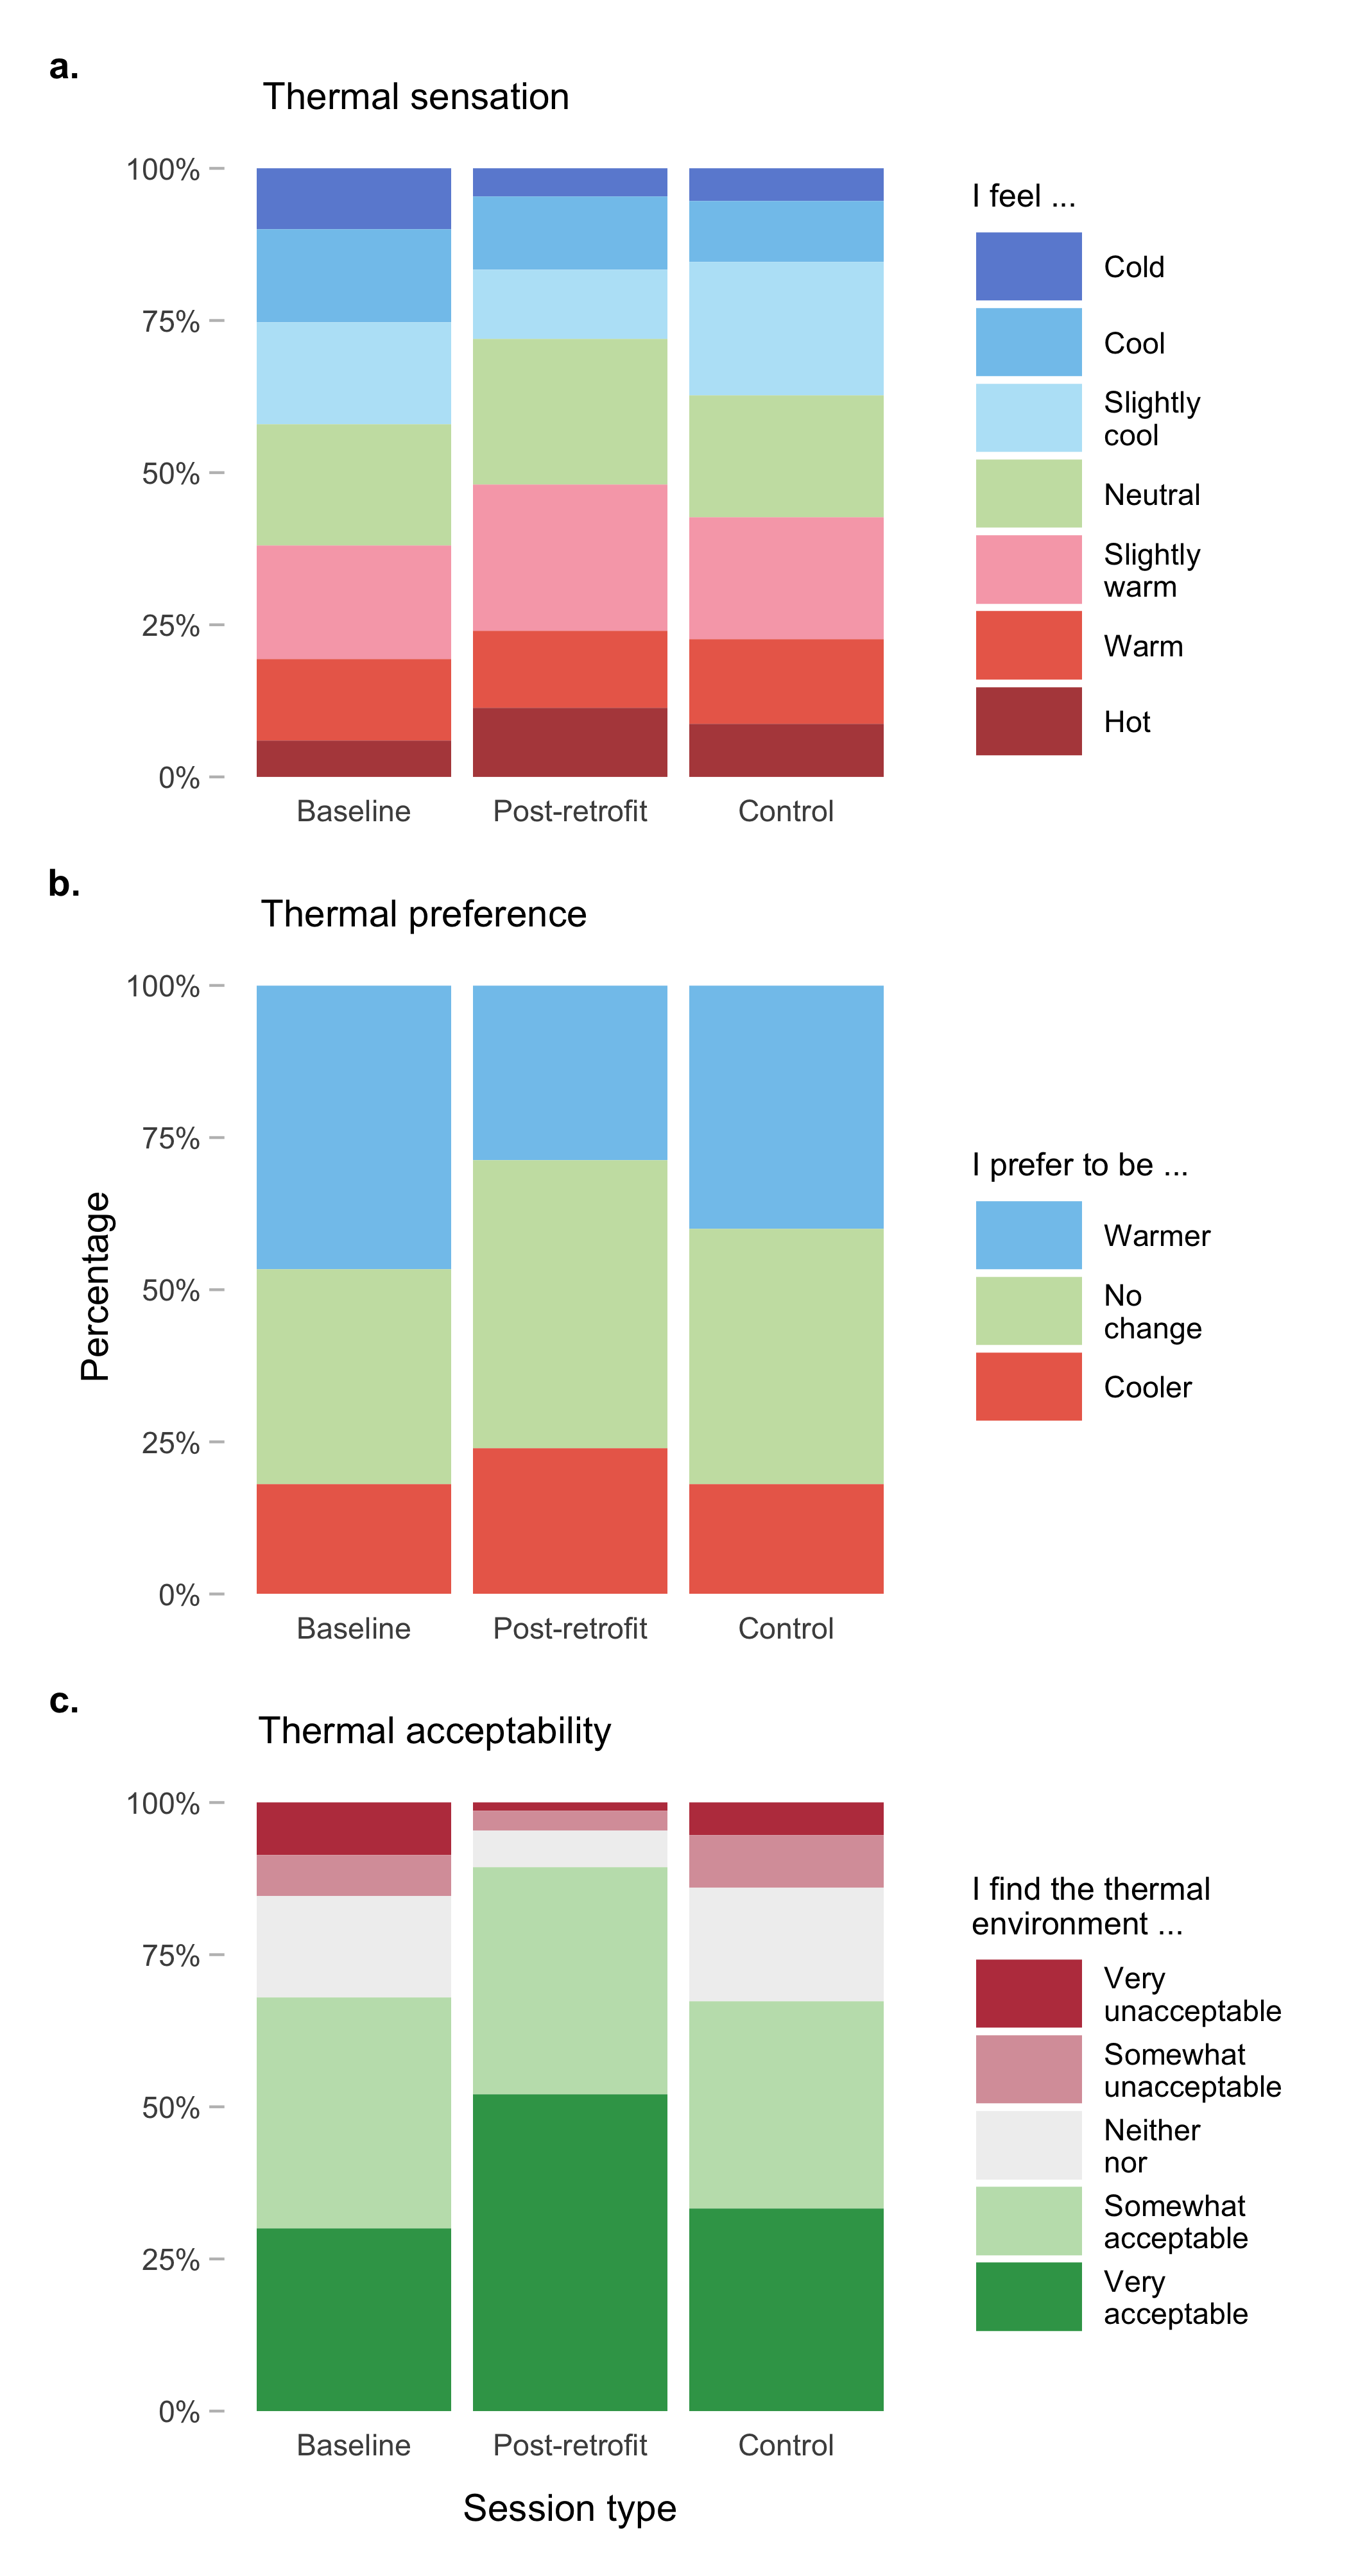
Combination of thermal sensation, thermal preference and thermal acceptability data into one figure.
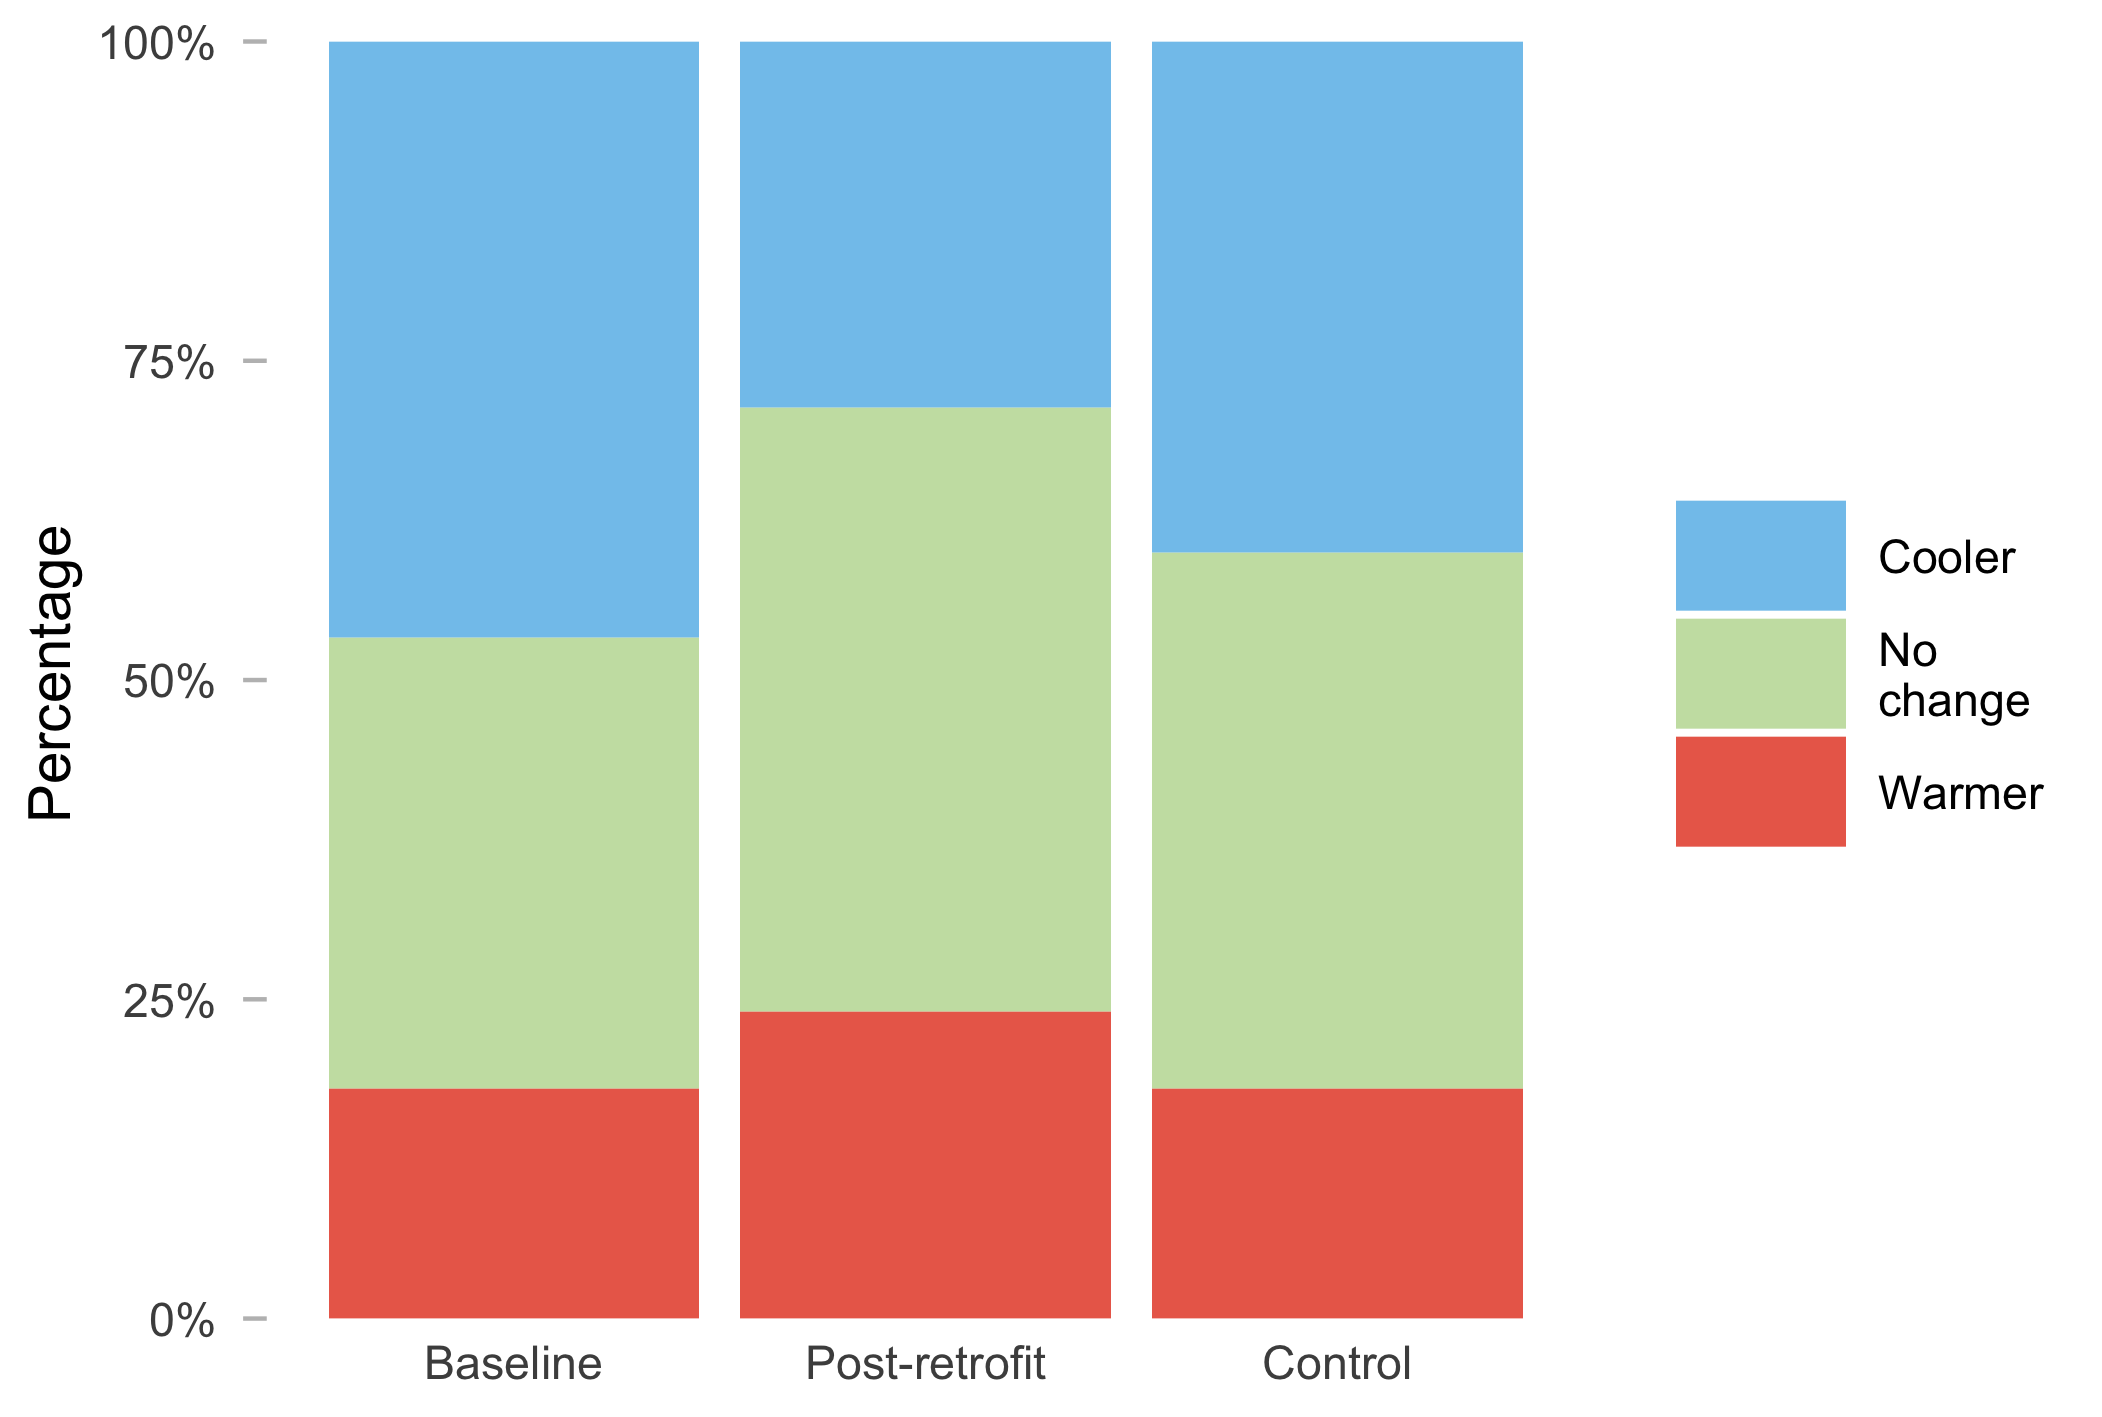
Distribution of thermal preference votes, e.g from survey data.
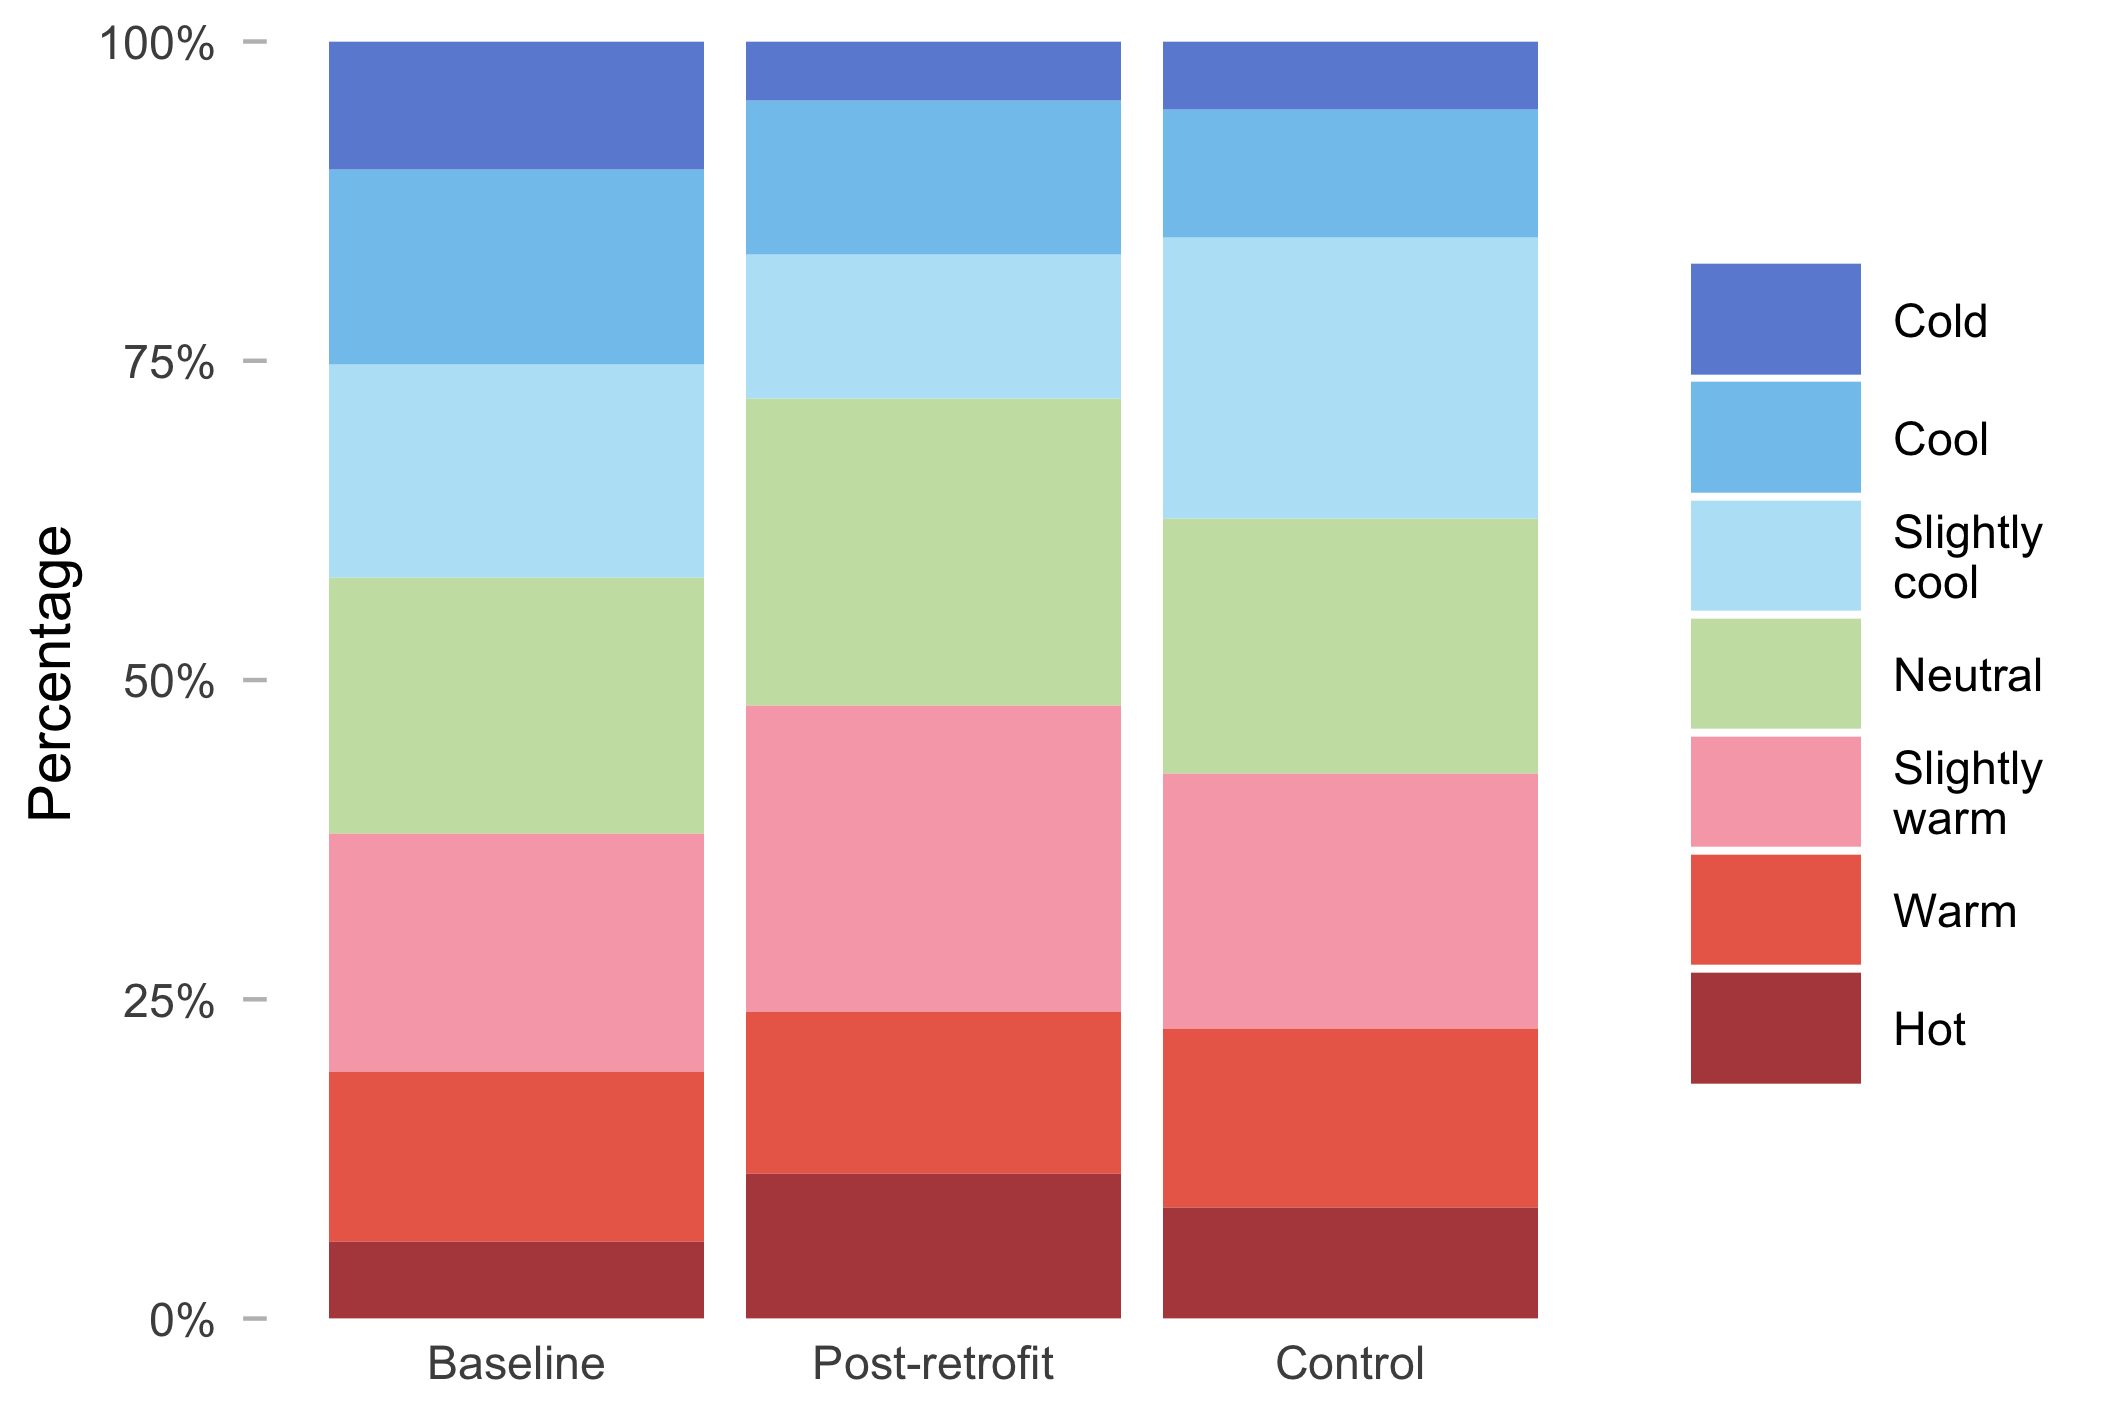
Distribution of thermal sensation votes, e.g from survey data.